
Hypervisor Resources Test
The Nutanix AHV host and the VMs operating on it share the compute and storage resources of the Nutanix platform. This is why, if one/more VMs on a host hog these resources, it will not only impact the performance of the other VMs of that host, but will also degrade the host performance as well. Likewise, a resource contention at the host-level can also adversely impact VM performance. To ensure that the host and VMs perform at peak capacity at all times, administrators should track how the AHV host and its VMs use the physical resources, proactively capture a potential resource contention, and precisely pinpoint the reason for the same - is it because of excessive resource usage by the AHV host? or are one/more VMs on the host resource-hungry? This is what the Hypervisor Resources test helps achieve. This test reports how the physical CPU and memory resources are used by an AHV host , and alerts you to erratic usage patterns. In the event of abnormal resource usage, the test also points you to the resource-starved VMs on the host, and thus reveals what is causing the usage anomaly - the VMs? or resource-intensive processing at the host-level?
Target of the test : A Nutanix AHV server
Agent deploying the test : A remote agent
Outputs of the test : One set of results for the Nutanix AHV server monitored.
| Parameter | Description |
|---|---|
|
Test Period |
How often should the test be executed |
|
Host |
The host for which the test is to be configured. |
|
Port |
The port at which the specified host listens. By default, this is NULL |
|
Prism Element IP |
If the eG manager had discovered the target Nutanix AHV server by connecting to the Nutanix Prism Element, then the IP address of the Nutanix Prism Element server used for discovering this Nutanix AHV server would be automatically displayed against the Prism Element IP parameter; similarly, the Prism Element User and Prism Element Password text boxes will be automatically populated with the Prism Element user credentials, using which Nutanix AHV discovery was performed. If this Nutanix AHV server has not been discovered using the Nutanix Prism Element, but you still want to monitor the Nutanix AHV server via the Prism Element, then select the IP address of the Prism Element server that you wish to use for monitoring the Nutanix AHV server from the Prism Element IP list. By default, this list is populated with the IP address of all Nutanix Prism Element hosts that were added to the eG Enterprise system at the time of discovery. Upon selection, the Prism Element user and Prism Element Password that were pre-configured for that Nutanix Prism Element will be automatically displayed against the respective text boxes. On the other hand, if the IP address of the Prism Element server of interest to you is not available in the list, then, you can add the details of the Prism Element server on-the-fly, by selecting the Other option from the Prism Element IP list. This will invoke the MANAGER DISCOVERY - VIRTUAL PLATFORM SETTINGS page. Refer to the Configuring eG Enterprise to Monitor Nutanix AHV |
|
Prism Element User, Prism Element Password and Confirm Password |
If the eG manager had discovered the target Nutanix AHV server by connecting to the Nutanix Prism Element, then the IP address of the Nutanix Prism Element server used for discovering this Nutanix AHV server would be automatically displayed against thePrism Element IP parameter; similarly, the Prism Element User and Prism Element Password text boxes will be automatically populated with the Prism Element user credentials, using which Nutanix AHV discovery was performed. If this Nutanix AHV server has not been discovered using the Nutanix Prism Element, but you still want to monitor the Nutanix AHV server via the Prism Element, then select the IP address of the Prism Element server that you wish to use for monitoring the Nutanix AHV server from the Prism Element IP list. By default, this list is populated with the IP address of all Nutanix Prism Element hosts that were added to the eG Enterprise system at the time of discovery. Upon selection, the Prism Element User and Prism Element Password that were pre-configured for that Prism Element server will be automatically displayed against the respective text boxes. On the other hand, if the IP address of the Prism Element server of interest to you is not available in the list, then, you can add the details of the Prism Element server on-the-fly, by selecting the Other option from the Prism Element IP list. This will invoke the MANAGER DISCOVERY - VIRTUAL PLATFORM SETTINGS page. Refer to the Configuring eG Enterprise to Monitor Nutanix AHV |
|
SSL |
By default, the Nutanix Prism Element server is SSL-enabled. Accordingly, the SSL flag is set to Yes by default. This indicates that the eG agent will communicate with the Prism Element server via HTTPS by default. |
|
WebPort |
By default, the Nutanix Prism Element server listens on port 9440. This implies that while monitoring a Nutanix AHV server via the Prism Element server, the eG agent connects to port 9440. |
|
DD Frequency |
Refers to the frequency with which detailed diagnosis measures are to be generated for this test. The default is 1:1. This indicates that, by default, detailed measures will be generated every time this test runs, and also every time the test detects a problem. You can modify this frequency, if you so desire. Also, if you intend to disable the detailed diagnosis capability for this test, you can do so by specifying none against DD frequency. |
|
Detailed Diagnosis |
To make diagnosis more efficient and accurate, the eG Enterprise embeds an optional detailed diagnostic capability. With this capability, the eG agents can be configured to run detailed, more elaborate tests as and when specific problems are detected. To enable the detailed diagnosis capability of this test for a particular server, choose the On option. To disable the capability, click on the Off option. The option to selectively enable/disable the detailed diagnosis capability will be available only if the following conditions are fulfilled:
|
| Measurement | Description | Measurement Unit | Interpretation |
|---|---|---|---|
|
CPU cores |
Indicates the number of CPU cores on the host. |
Number |
|
|
CPU sockets |
Indicates the number of CPU sockets on the host. |
Number |
|
|
CPU frequency |
Indicates the frequency per CPU core. |
GHz |
|
|
CPU capacity |
Indicates the total CPU capacity of this host across all cores. |
GHz |
|
|
CPU usage |
Indicates the percentage of CPU resources used by the host and the VMs. |
Percent |
A value close to 100% is a cause for concern, as it signals a potential CPU contention on the host. In such a case, use the detailed diagnosis of this measure to view the top-10 CPU-consuming VMs on the host. From this, you can instantly identify the VM that is hogging the CPU resources. If no VM appears to be consuming CPU excessively, then you can conclude that resource-intensive processing at the host-level is causing the contention. |
|
Memory capacity |
Indicates the total memory capacity of the host. |
GB |
|
|
Memory used |
Indicates the total amount of memory used by the VMs and the host. |
GB |
A low value is desired for this measure. |
|
Available memory |
Indicates the amount of physical memory still unused on the host. |
GB |
A high value is desired for this measure. |
|
Memory utilization |
Indicates the percentage of memory used by the VMs and the host. |
Percent |
A value close to 100% is indicative of excessive memory utilization. In such a situation, use the detailed diagnosis of this measure to view the top-10 memory consuming VMs on the host. From this, you can instantly identify the VM that is hogging the memory resources. If no VM appears to be consuming memory excessively, then you can conclude that memory-intensive processing at the host-level is causing the contention. |
|
Available memory |
Indicates the percentage of memory that is still unused on the host. |
Percent |
Ideally, the value of this measure should be high. A consistent drop in this value is indicative of excessive memory usage. In such a case, use the detailed diagnosis of the Memory utilization measure to isolate the cause of the memory drain. |
|
Oplog disk size |
Indicates the current size of the oplog. |
GB |
The OpLog is similar to a filesystem journal and is built as a staging area to handle bursts of random writes, coalesce them, and then sequentially drain the data to the extent store. A portion of the metadata disk is reserved for the oplog, and you can change the size through the nCLI. |
|
Oplog disk usage |
Indicates the percentage of allocated space that is used by the oplog. |
Percent |
A value close to 100% indicates that the oplog is running out of space. This can happen if data is rapidly written to the oplog but is not drained from the log just as quickly. You may want to consider resizing the oplog to ensure that there is always room for writing more data. |
Use the detailed diagnosis of the CPU usage measure to view the top-10 CPU-consuming VMs on the host. From this, you can instantly identify the VM that is hogging the CPU resources.
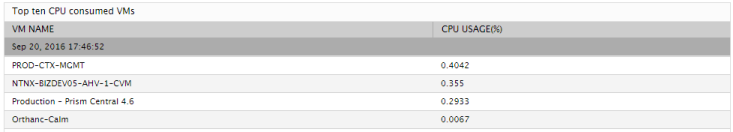
Figure 1 : The detailed diagnosis of the CPU usage measure
Use the detailed diagnosis of the Memory utilization measure to view the top-10 memory consuming VMs on the host. From this, you can instntly identify the VM that is hogging the memory resources.
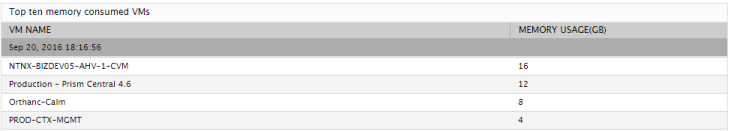
Figure 2 : The detailed diagnosis of the Memory utilization measure
