
Monitoring Oracle Primavera
eG Enterprise offers a specialized monitoring model that monitors the application inside-out and sheds light on current or probable performance dips that the application might experience due to various infrastructure or network issues.
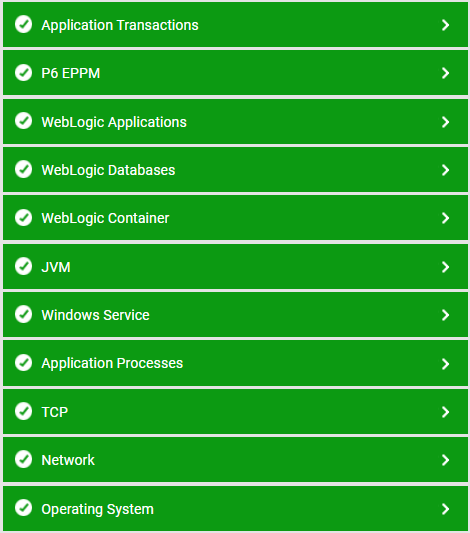
Figure 1 : The layer model of the Oracle Primavera
Every layer of Figure 1 is mapped to a wide variety of tests that monitor critical performance parameters such as number of users, type of users, memory used, job performance, connections pool performance, and quantity of data in the database.
The metrics so collected would enable administrators to find accurate answers for the following queries:
-
What is the operational state of the P6 EPPM?
-
Is the current hardware available able to handle the load of projects and user activity?
-
What are response times for the users?
-
Will the system able to perform if more projects and users are on-boarded?
-
How much load system can take?
-
What is the current state of jobs running on the server?
-
What is the percentage of jobs failures, is it under tolerance limit?
-
How much average time does jobs execution take?
-
What is the maximum time taken by jobs before successfully completing?
-
How much time it takes for new client to connect to the sever?
-
What is the percentage of failed connection attempts by clients.?
-
What is the average time for SQL queries take to complete on underlying P6 database?
