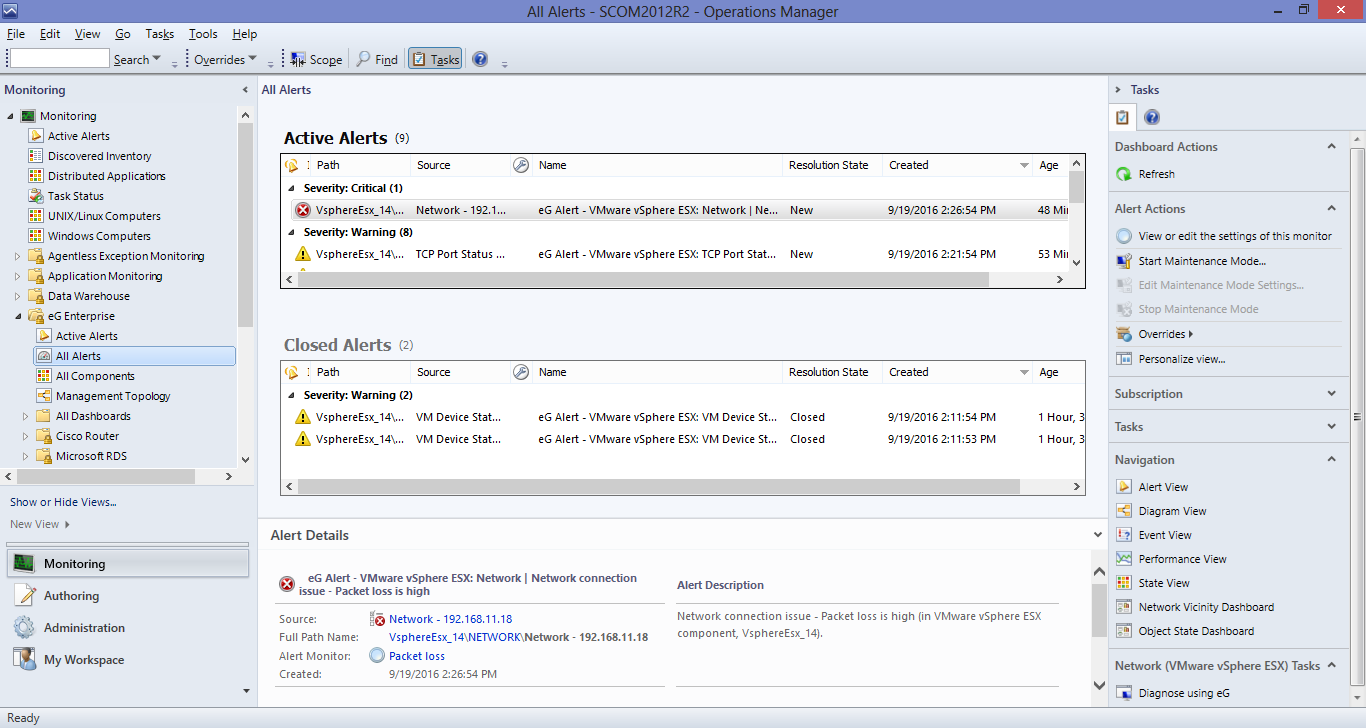
Viewing All Alerts
To view the alert history of eG-managed components from the SCOM console, do the following:
If the documentation phase of the Project Life Cycle likely depends on your role in the IT organization. If you are a manager or project lead, documentation is critical to the success of the project. If you are in a non-managerial position, documentation is an annoying nuisance that gets in the way of your real work. While the 10 tips below are mainly targeted toward the latter category, managers and supervisors can also benefit from them.
-
Click on the All Alerts sub-node of the eG Enterprise node in the tree-structure in the left panel of the SCOM console.

-
The right dashboard panel will then display all alerts that were raised on the eG-managed components (see Figure 1). Here again, the alerts will be grouped by severity. Also, like in the Active Alerts view, each alert in the All Alerts view will display the alert Path, Source, Name, Resolution State, Created date/time, and Age, by default. If one/more problems were resolved, then the Resolution State of such alerts will be Closed. Closed Alerts will be displayed in a separate section in the alerts view. The Closed Alerts section will display alerts on the basis of the following criteria: “View all alerts with Closed(255) resolution state”. New alerts will be displayed on the basis of the following criteria: “View all alerts with New(0) resolution state”.
You can access the eG knowledge base (i.e., the eG online help system) from the All Alerts view, and also launch the eG monitoring console to perform deeper diagnosis of a particular problem.
Note:
Clicking on the Diagnose using eG option will launch the eG monitoring console only if the eG Console Tasks application is installed on the system on which the SCOM console is operating. To know how to install this application, refer to Installing the eG Console Tasks Application. Also, when the eG console is launched for the very first time from the SCOM console, a login screen will appear, where you will have to manually key in the user credentials for logging into the eG monitoring console. The same credentials will be used to launch the eG monitoring console during your subsequent attempts to Diagnose using eG.


