Introduction
Ever since business entities decided to go online with their service offerings, they have been having trouble dealing with a fast-expanding customer base and ever-mounting customer concerns. The lack of any efficient mechanism to manage the growing list of permanent/probable users to the service, caused the enterprise to lose millions; delays in follow-up calls lead to slow or no conversions, and poor customer support resulted in a loss of goodwill. That should explain why the service sector organizations providing business-critical services to end-users, have been turning to Customer Relationship Management (CRM) solutions like Siebel for help.
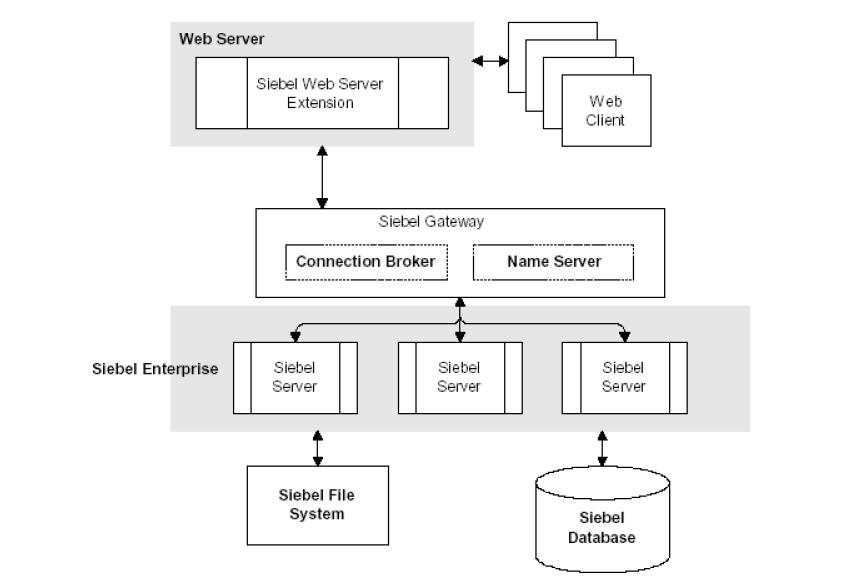
Siebel CRM-packaged business applications have become key enablers of an enterprise’s customer-facing business processes. From tracking enquiries received from prospects to providing timely support to customers, the Seibel CRM modules automate the complete spectrum of activities that form part of an enterprise's marketing, sales, and support cycles. The wide capabilities of the Siebel solution demand a complex architecture; accordingly, you have a Siebel web client that front-ends requests to a Siebel web server, a Siebel gateway that grants the web requests access to the Siebel application servers, the Siebel application servers that process the requests by applying the business logic, and finally, the database server which stores and maintains the resultant data.

Figure 1 : A high-level view of the Siebel application suite architecture
As multiple tiers of components are at work here, a problem with one tier/component can ripple and affect the performance of the dependent tiers. Siebel administrators therefore, often find it very difficult to determine where the real problem lies - is it with the Siebel web server? the Siebel gateway? the Siebel application server? or the database? The source of the problem has to be identified and necessary correction/optimization steps need to be taken to improve service performance and avoid service outages. What Siebel administrators need therefore, is an integrated solution that can monitor the entire chain of Siebel enterprise servers, taking into consideration the inter-dependencies that exist between them.
The eG Enterprise, with its 100% web-based architecture and patented correlation and root-cause diagnosis capability, is ideal for monitoring Siebel environments. This solution offers exclusive monitoring models for analyzing the availability and overall health of every Siebel component. The data collectors employed by the suite extract a wide variety of performance statistics pertaining to the availability, responsiveness, session information, error logs and key tasks executing on these components. Besides measuring the health of the critical ingredients of a typical Siebel infrastructure, eG Enterprise also focuses on the performance of the operating systems that host the Siebel Enterprise components. Accordingly, a wealth of host-level performance information, which includes metrics on resource (CPU/memory/disk) usage by the host, key processes executing on the host, network availability and traffic to and from the host, etc., are collected. Using such extensive performance data, administrators can easily find answers to common Siebel Enterprise related queries like:
Moreover, the suite's end-to-end service monitoring capability and its patented root-cause diagnosis algorithm enable automatic correlation of the performance of the various Siebel components and quick and accurate problem isolation. By graphically representing a Siebel environment (see Figure 2), eG Enterprise enables administrators to quickly understand the interdependencies among Siebel components and their cause-effect relationships, and accurately judge root-cause of issues.

Figure 2 : The topology model of the monitored Siebel environment


