Monitoring Zones/Segments/Services using eG Monitor App
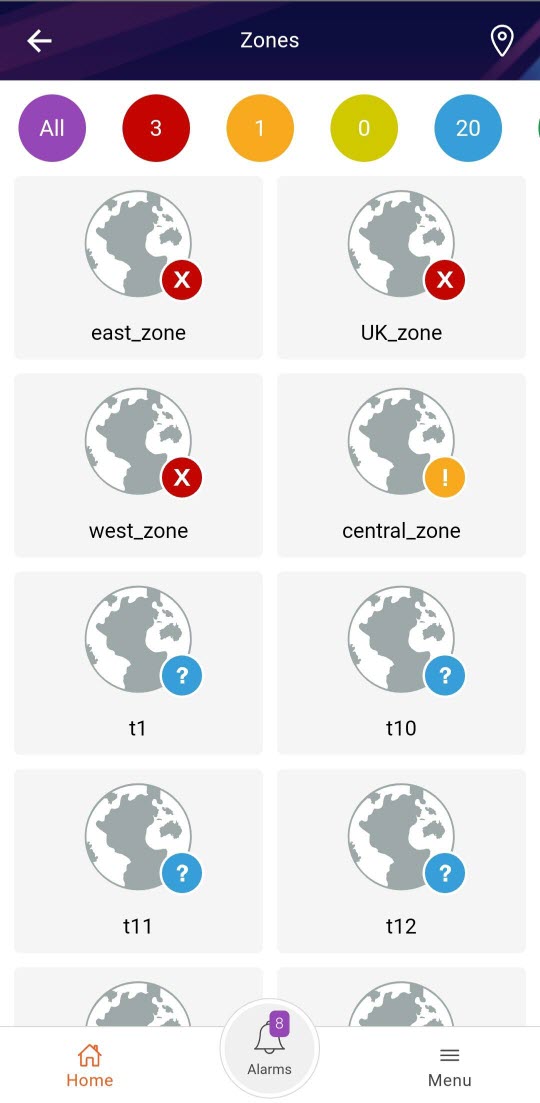
To zoom into the status of a zone, first click a doughnut chart corresponding to the zones in the Home (Figure 1) tab screen. This will invoke Figure 1.

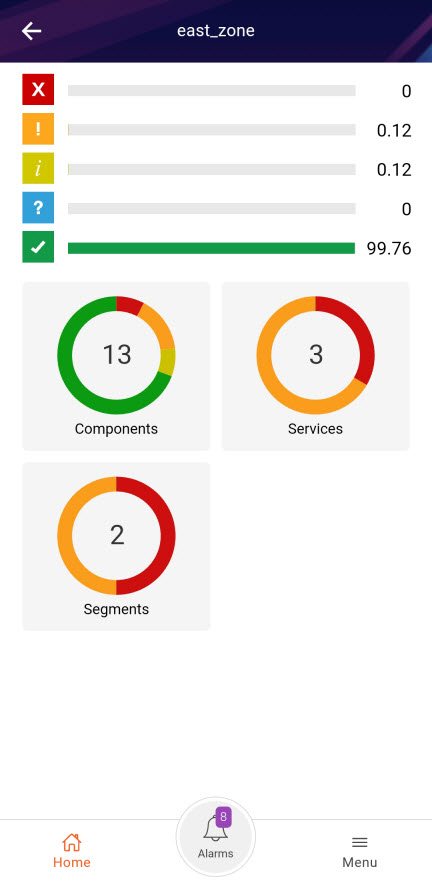
Upon clicking the zone, the list of components/services/segments that are associated with the chosen zone will be displayed as shown in Figure 2.

Figure 2 : All managed elements of a chosen zone
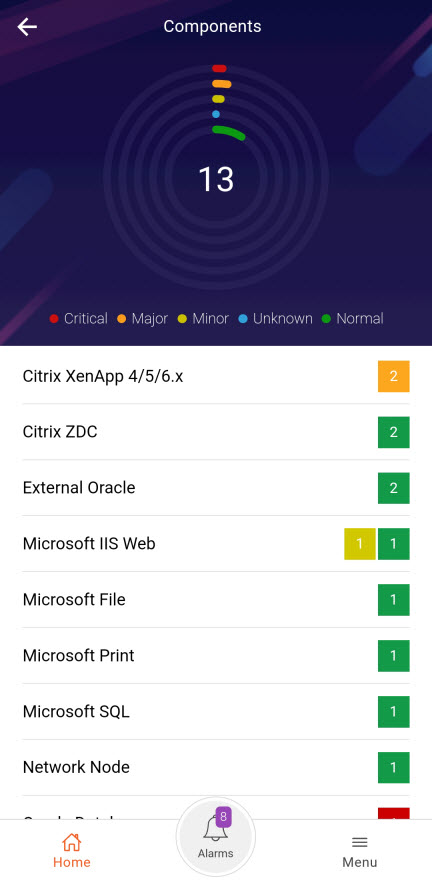
Clicking on any Components/Services/Segments doughnut chart will lead you to a Components/Services/Segments screen that displays the componets/services/segments in the chosen zone. For instance, fig 3 is showing the Components screen that appears when you click the Components doughnut chart in the chosen zone screen.

Figure 3 : Components associated with the chosen zone
To know how the components are being monitored by eG, refer to the Monitoring Components using eG Monitor App.
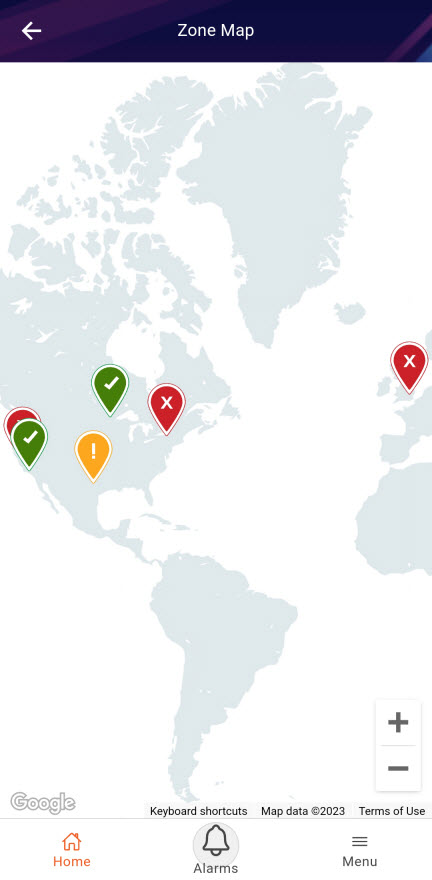
Typically, zones are associated with different geographies. While monitoring large infrastructures therefore, eG mobile app also allows you to drill down to view the exact geographic area where a zone operates, and instantly evaluate the performance of different zones spread across different locations worldwide. To access the map interface that provides this visual treat, click the ![]() icon in the righrt corner of the Zones page (see Figure 1). Figure 4 then appears indicating the zone locations and their current state.
icon in the righrt corner of the Zones page (see Figure 1). Figure 4 then appears indicating the zone locations and their current state.

Likewise, you can click on any segment/service doughnut chart in the Home page of the mobile app to view the state of the segment components and state of the services. To know more details about monitoring the zones/segements/services, refer Administering eG Enterprise document.


