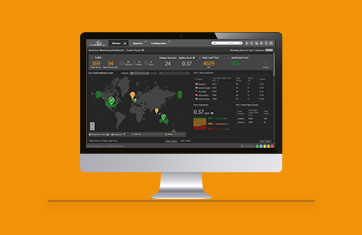
GlassFish
What is the GlassFish application server?
GlassFish is an open-source, fully Java EE-compliant application server (including support for Java Servlets, JSPs, EJBs, JPA, JMS and more). It provides a platform for developing, deploying, and managing Java-based enterprise applications. It is developed by the Eclipse Foundation and is based on the Java EE reference implementation.
GlassFish has gained popularity as an open-source alternative to other Java EE application servers. It is widely used for developing and deploying Java EE applications in various enterprise environments.

The Key Features of GlassFish
GlassFish offers a range of key features that facilitate the development, deployment, and management of Java applications. Some of the notable features include:
- Java EE Compliance: GlassFish is fully Java EE compliant, adhering to the complete set of Java EE specifications. This compliance ensures compatibility with a wide range of Java EE applications and frameworks.
- Administration and Management: GlassFish includes a web-based administration console that provides a user-friendly interface for managing and configuring the server. Administrators can monitor server health, configure resources, manage security settings, and deploy applications.
- Clustering and High Availability: GlassFish supports clustering, allowing multiple server instances to form a cluster for load balancing and high availability. Clustering ensures that applications remain accessible even if some server instances fail. GlassFish also provides session replication and failover mechanisms to maintain session state across cluster nodes.
- Performance and Scalability: GlassFish is designed to deliver high performance and scalability. It includes features like connection pooling, request processing optimization, and caching to improve application performance.
- Developer Productivity: GlassFish offers features that enhance developer productivity. It supports hot deployment, allowing applications to be redeployed without server restarts, which speeds up development cycles. It integrates with popular development environments like Eclipse and NetBeans, providing seamless development, debugging, and profiling capabilities.
Are the built-in monitoring capabilities of GlassFish sufficient?
GlassFish includes a web-based administration console that provides a graphical user interface for monitoring and managing the server. The console displays real-time information about server health, resource usage, and application statistics. It allows administrators to monitor thread pools, JDBC connection pools, JMS resources, and other server resources.
From the built-in monitoring capabilities, you can understand the usage of the GlassFish application server and identify bottlenecks within the server. However, many enterprise deploying GlassFish are looking for more comprehensive end-to-end monitoring capabilities. Key requirements include:
- Monitoring the experience of applications deployed on GlassFish using a combination of synthetic monitoring and real-user monitoring.
- In-depth insights into the performance of the underlying JVM
- Code-level visibility to identify slow queries, slow third party calls, external web service calls, etc.
Only with such comprehensive insight can IT admins answer today’s toughest question “Why is my application slow?”.
What are some of the key metrics to track to monitor the GlassFish application server?
Since GlassFish runs on a Java virtual machine, it is essential to monitor the JVM and its internals in-depth. Performance of the JVM garbage collector, usage of the JVM’s heap memory, threads running in the JVM are some of the key metrics to collect. GlassFish exposes key metrics about the application server via Java Management Extensions interfaces so monitoring tools can track the application server’s performance. GlassFish application server logs are also a great source of metrics. Access logging must be turned on for this. To get greater insights into applications hosted on GlassFish, distributed transaction tracing can be implemented using tools like eG Enterprise.
Learn more about the converged application and infrastructure monitoring approach that eG Enterprise uses: https://www.eginnovations.com/converged-application-infrastructure-monitoring


