In today's era, where businesses are driven by digital frameworks, it is imperative for IT and web operations teams to monitor how users interact with web applications and what experience they see. Using a real user monitoring (RUM) tool, they can track the experience of users accessing a web application.
RUM tools also provide sufficient insight to identify whether an application is slow, and if so, where the problem lies: whether it is a front-end issue, a network issue, a content download problem, or due to server-side processing. When the server-side processing is causing slowness, application owners need to understand which of the application tiers – middleware, backend database, external application access, message queues, etc. – is responsible for the slowness and why.
How Business Transaction Monitoring Helps
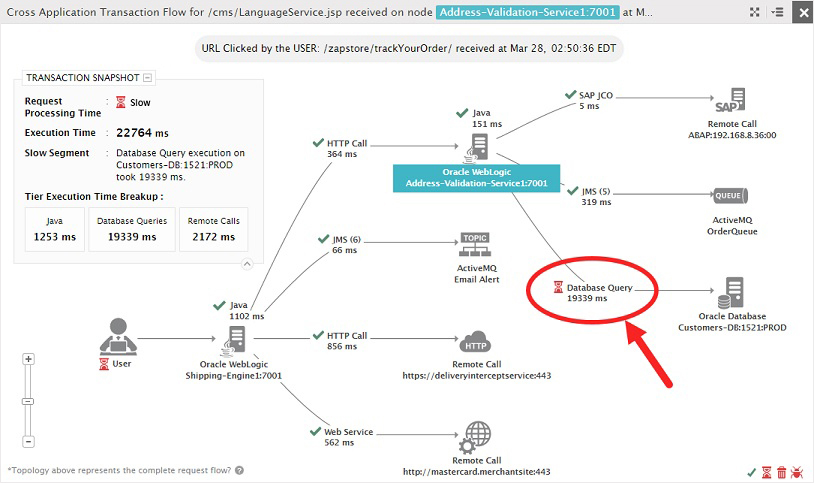
Business transaction monitoring is the approach commonly used to identify and diagnose server-side processing slowness for web applications. Using byte-code instrumentation and tag-and-follow techniques, business transaction tracing highlights the time spent at each of the application tiers by following each request as it is processed. Using this information, IT operations teams and web application managers can identify problems such as:
- Badly designed business logic in the application code that can take up excessive time to process
- Poorly written database queries that require a lot of time to execute
- Web service calls to third party, external components that are taking time
 Business transaction monitoring pinpoints the exact cause of slowness
Business transaction tracing is one of the critical dimensions of application performance monitoring (APM). With no application code changes, business transaction tracing provides insights that help an operations team member identify where the problem lies. Web developers can identify which portion of their Java or .NET code they need to optimize. They can also analyze to see which queries need to be tuned for faster response (for example, by making better use of database table indexes).
 Identifying a database query that is slowing application access
The Scope of Business Transaction Tracing, and Where It Stops
While it is an important component of an application performance monitoring strategy, a key question is whether business transaction tracing is sufficient for ensuring peak application performance. To answer this, consider a scenario where there is a database slowdown in the backend that is affecting all accesses to the database.

Diagnosis using transaction tracing:
- Business transaction tracing shows that database processing is slowing down web accesses
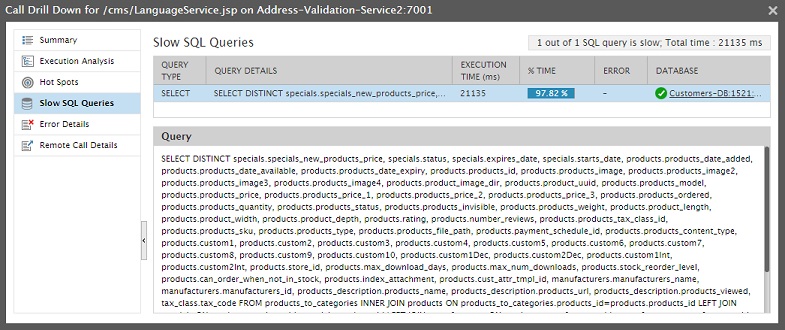
- Drilldowns provide details of the queries that are slow
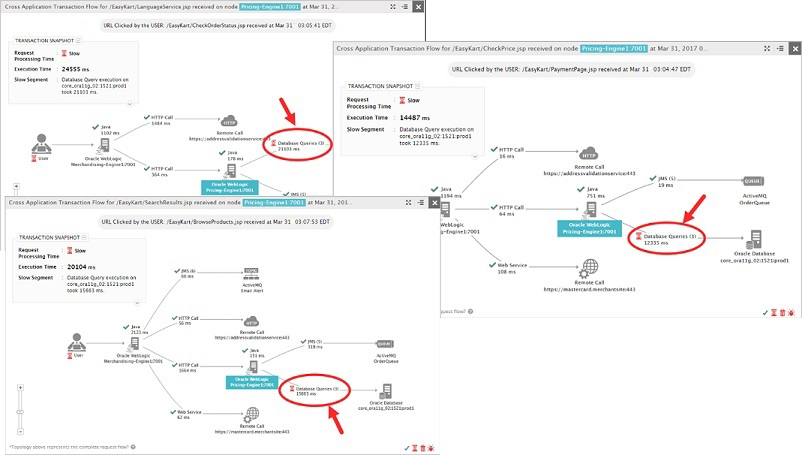
- Since there is a database-wide slowdown, transaction tracing points to different queries that are slow, making it impossible to pinpoint one or multiple queries that are slowing the application

Database query processing is causing the web application to be slow
In such a scenario, transaction tracing will help identify the application tier (in this case, the database) that is responsible for slowness, but cannot pinpoint the root cause of the problem.
This scenario highlights where transaction tracing is useful as well as its limitations: Transaction tracing is very effective when application performance is affected by code-level issues. However, when there is an infrastructure slowdown, transaction tracing is not sufficient for diagnosing this issue and identifying the root cause for application slowdown.
To summarize, business transaction monitoring is a key piece of the application performance monitoring framework, but not the solution in and of itself for root cause diagnosis and problem resolution. IT teams need deeper, far-reaching, infrastructure-wide correlated visibility for accurate problem diagnosis and faster resolution to effectively support today's digital business.

