The original review was published on LinkedIn: https://www.linkedin.com/pulse/monitoring-azure-virtual-desktop-eg-enterprise-freek-berson/.
The review has been republished below with Freek's permission.
I'm impressed what eG Enterprise has to offer in end-to-end monitoring for Azure Virtual Desktop. The auto discovery capabilities, including out of the box thresholds, allow for easy and fast configuration. Getting detailed insights in logon duration, application launch times and the perceived end user experience is great. The ability to gather load simulation tests details using a synthetic user is super helpful and the way they are displayed in the console is great. 

Freek Berson
Azure Virtual Desktop evangelist and enthusiast, Wortell

Why Azure Virtual Desktop, and Why Today?
If there is one thing we learned over the past 2 years, it is that hybrid work is here to stay. Many organizations have struggled with the challenges of working entirely remote during the early days of the pandemic. Digital transformation took a giant leap, and there is no way back. Businesses and organizations are no longer operated the way they were before 2020, and people, who are the most crucial part of a successful digital transformation, have different mindsets and priorities. It requires organizations to adapt and think differently on how to provide a flexible working environment and workplace for everyone.
Looking back, the generally availability of Azure Virtual Desktop could not have come at a better time. Early 2020 I have helped many organizations embrace Azure Virtual Desktop to provide a secure workplace for everyone in a fast and flexible way. To date, Azure Virtual Desktop has grown into a mature platform and got even more traction with the release of Windows 365, Microsof's Desktop as a Service on top the Azure Virtual Desktop platform.
Where do Innovative Ecosystem Partners Come in?
Even though Azure Virtual Desktop is a feature rich platform, Microsoft works with a large number of ecosystem partners that provide additional value on top of native Azure Virtual Desktop. As more organizations start to use Azure Virtual Desktop, one of the topics that becomes more and more important is getting insights in usage, performance, and monitoring. Out of the box, Azure Virtual Desktop comes with AVD Insights. This is a set of workbooks and dashboards that provides information on the usage of Azure Virtual Desktop based on telemetry data that is being collected in an Azure Log Analytics Workspace. It provides insights on things like average use, concurrency, average logon times, session diagnostics and host performance. Although AVD Insights already provides a lot of information, it is a dashboard that focusses on just the Azure Virtual Desktop layer. The end user experience in Azure virtual Desktop is determined by many more components and services. AVD Insights also not does not tell us much on the perceived end user experience and only allows pinpointing a root cause of a problem to a certain extend.
eG Enterprise for End-to-end Monitoring of
Azure Virtual Desktop
In scenarios where you want to pinpoint slowness of a user session, get detailed insights on sessions and applications that are used, spot issues in the supporting Cloud infrastructure beyond the Azure Virtual Desktop resources, or want to periodically create detailed reports, you need a 3rd party solution. I've had the privilege to personally test drive eG Enterprise 7.2 during a private preview which includes capabilities to monitor Azure Virtual Desktop to provide answers to these questions. In this article I'm sharing some of my experiences.
Sharing My Experience with eG Enterprise for
Azure Virtual Desktop
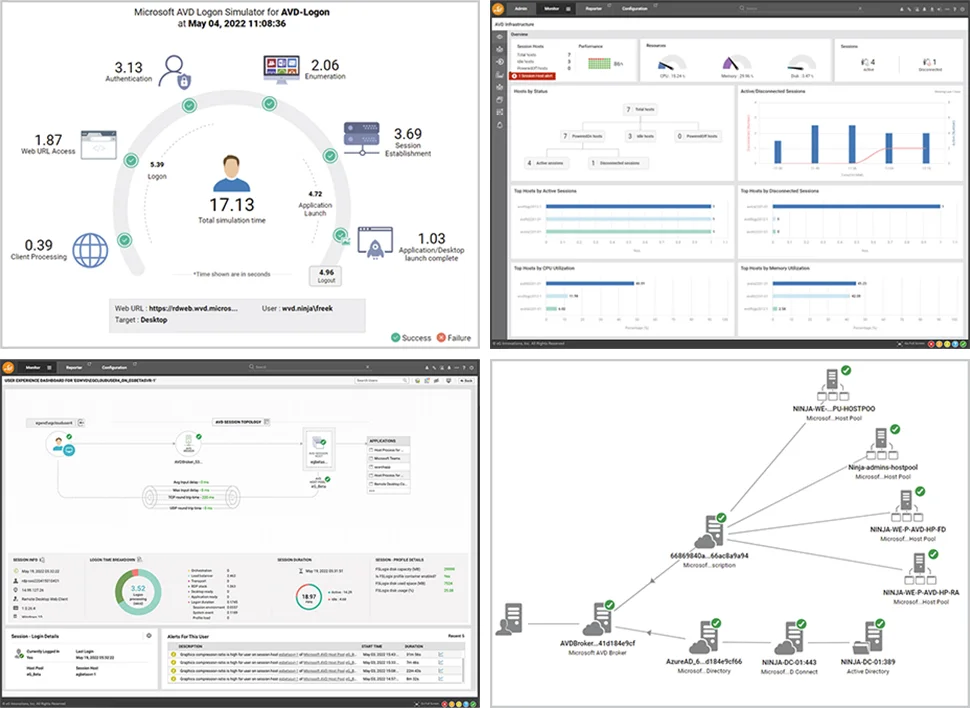
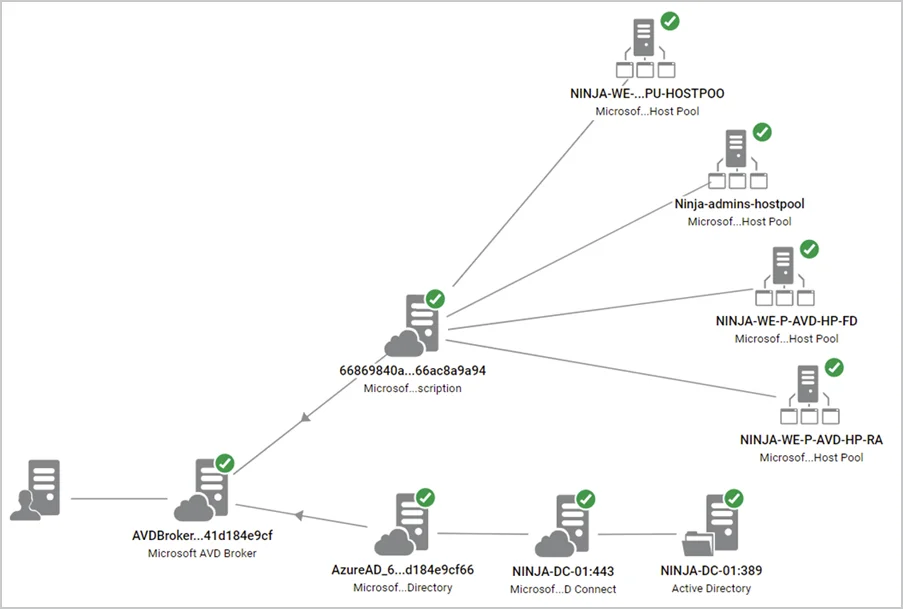
First of all, the console of eG Enterprise is entirely web-based, which is great. In my case I'm using eG Enterprise Cloud. As the screenshot below shows, you get an end-to-end topology of the health of our Azure Virtual Desktop environment. Beyond the Azure Virtual Desktop services and session hosts, you can also include supporting infrastructure like Azure Active Directory, Active Directory Domain Services, Azure AD connect and any backend servers or services you are using.

AVD Components
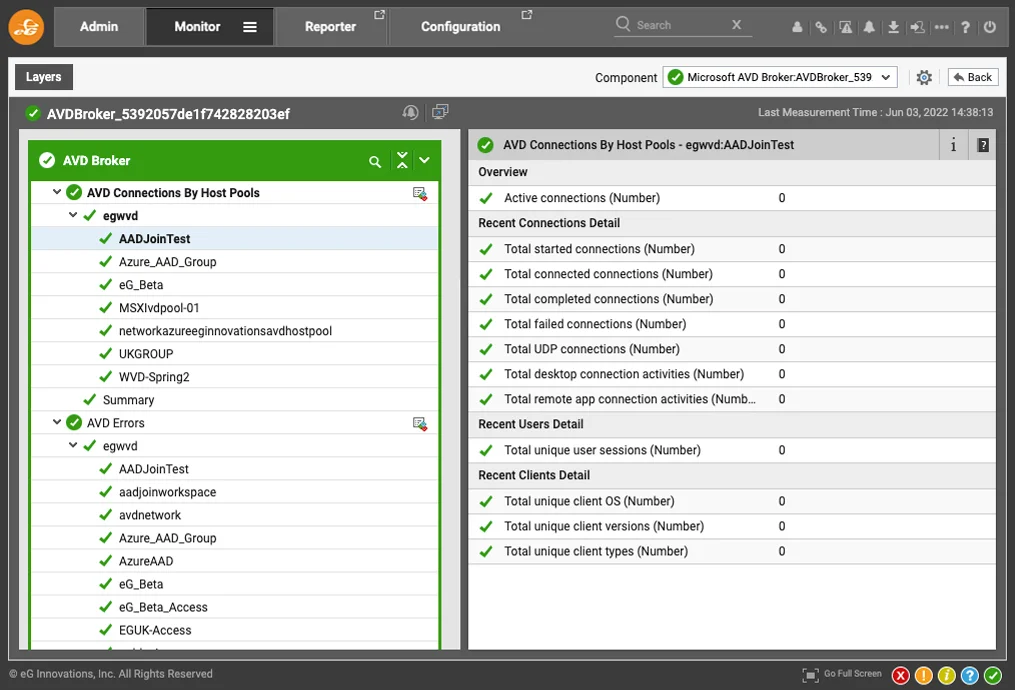
Starting with the AVD Brokering services, eG Enterprise provides in-depth details about the Azure Virtual Desktop service by covering your workspaces, app groups and host pools. The example below focuses on a specific host pool showing all details about the current usage. eG Enterprise also has auto-discover functionality for host pools, which makes the configuration super easy.

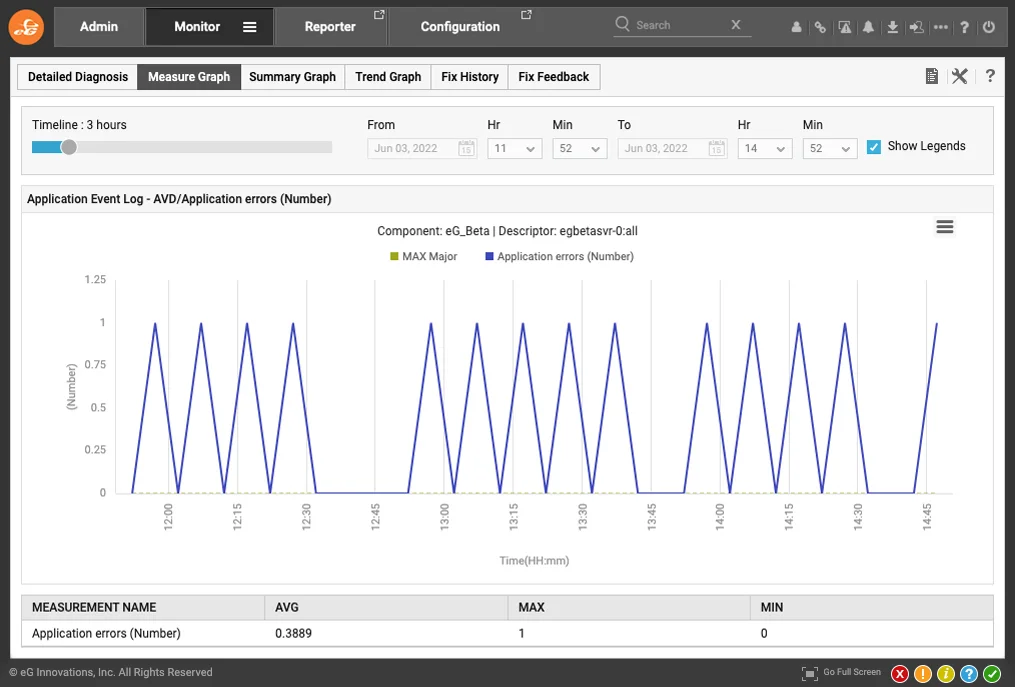
The great thing here, and this goes for entire console, is that you can click on any items and get more information and history. For example, the screenshot below shows the available Session Hosts over the last 3 hours.

AVD Services
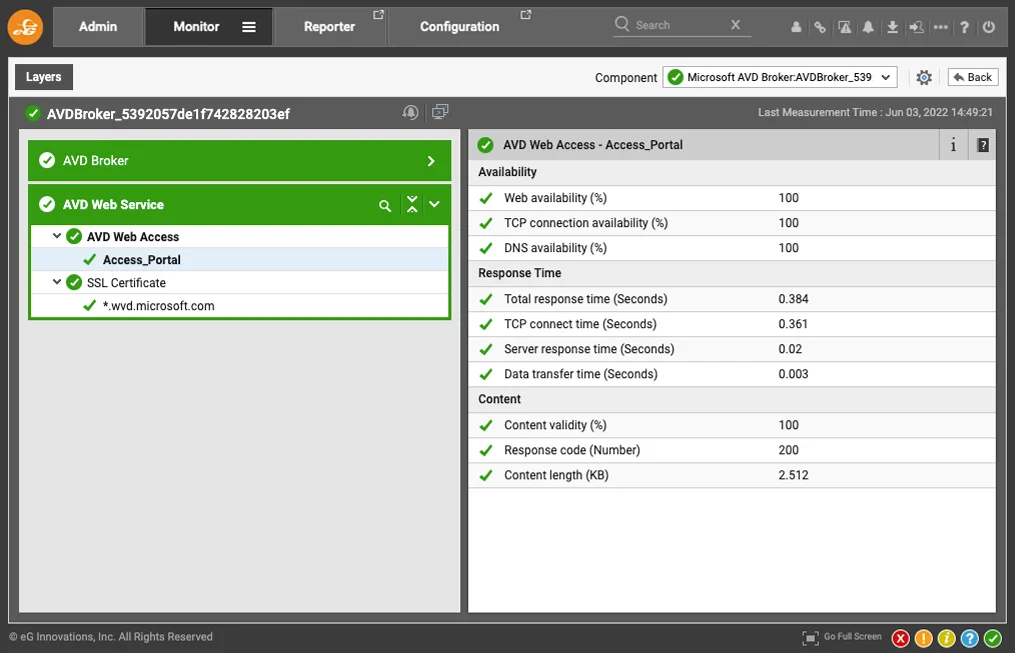
Besides the AVD components you are running, eG Enterprise also monitors the AVD Service itself. For example, detailed availability of the AVD Web Access services as shown below.

AVD Session Hosts
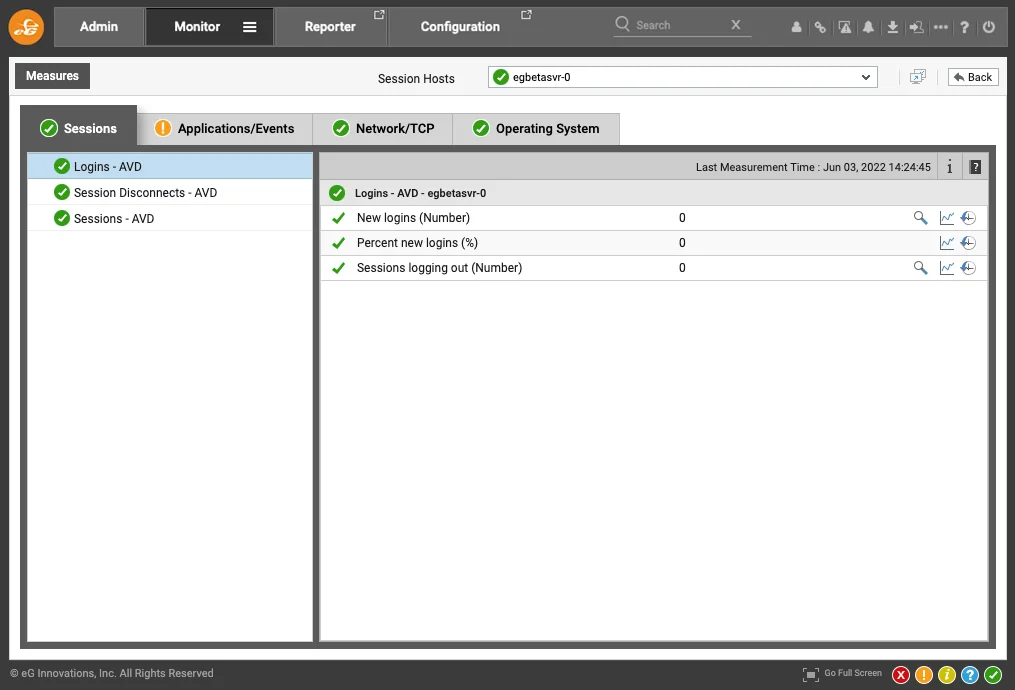
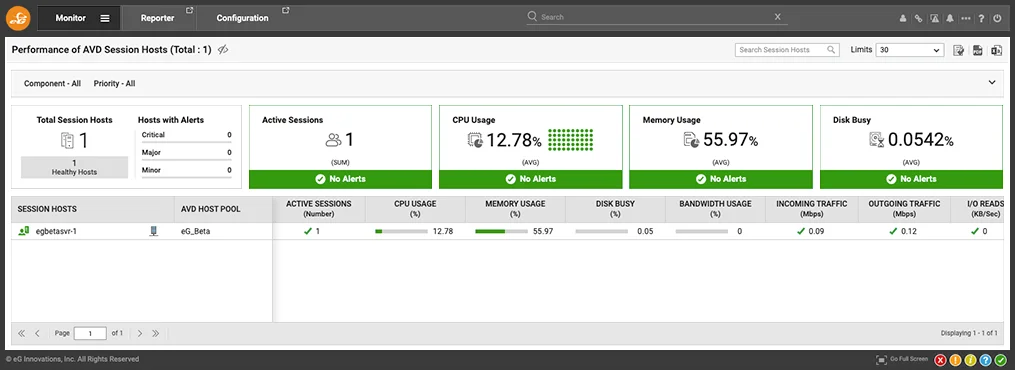
If you drill down into the one of the host pools, you can easily navigate to the performance of a single session host. This allows you to get a very detailed overview of the metrics of user sessions of a single session host as shown below.

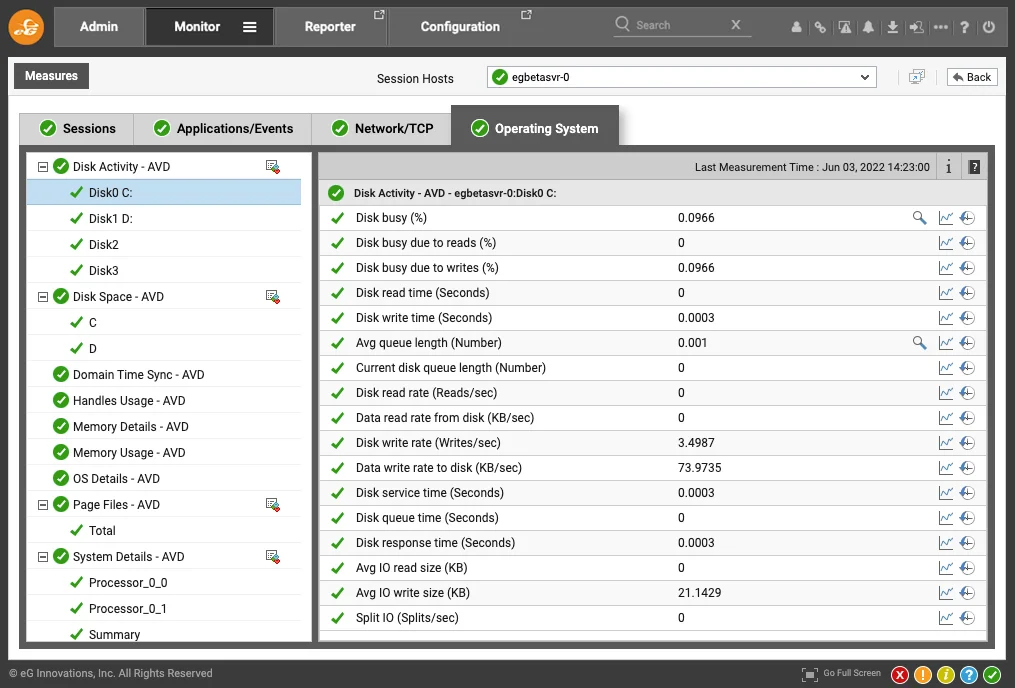
Drilling down further you can also get detailed information about the operating system.

User Sessions
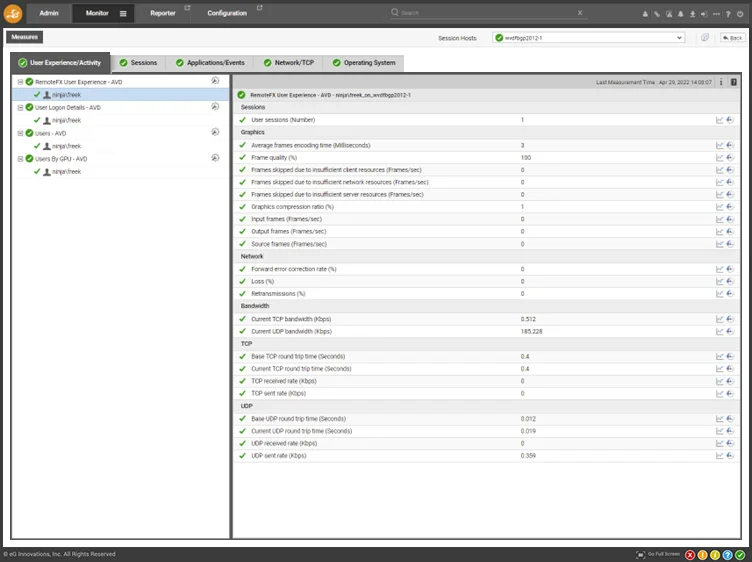
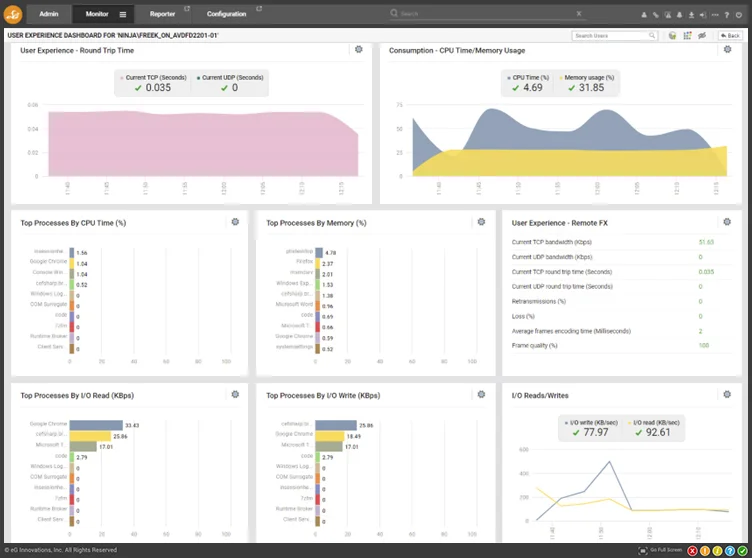
Were eG Enterprise really excels is the ability to keep on drilling down into more details, for example the ability to get detailed information about the experience of a single user session.

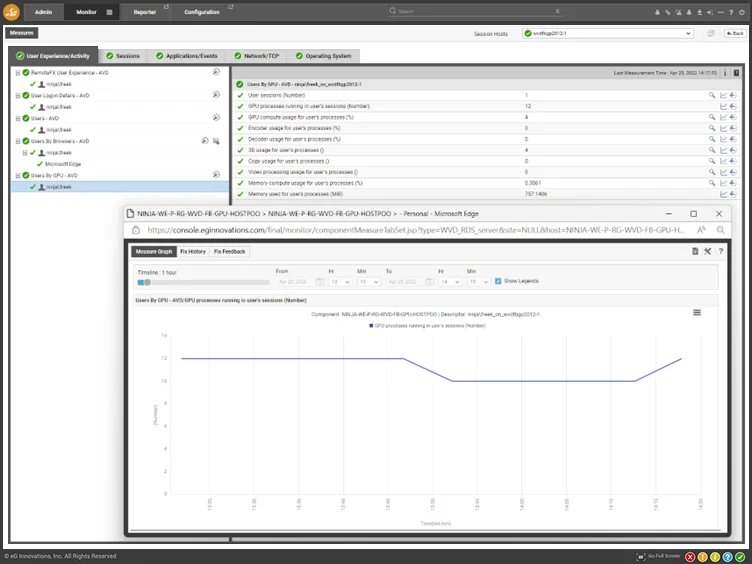
And in this specific use case, I'm investigating more detailed GPU performance inside the Session Host.

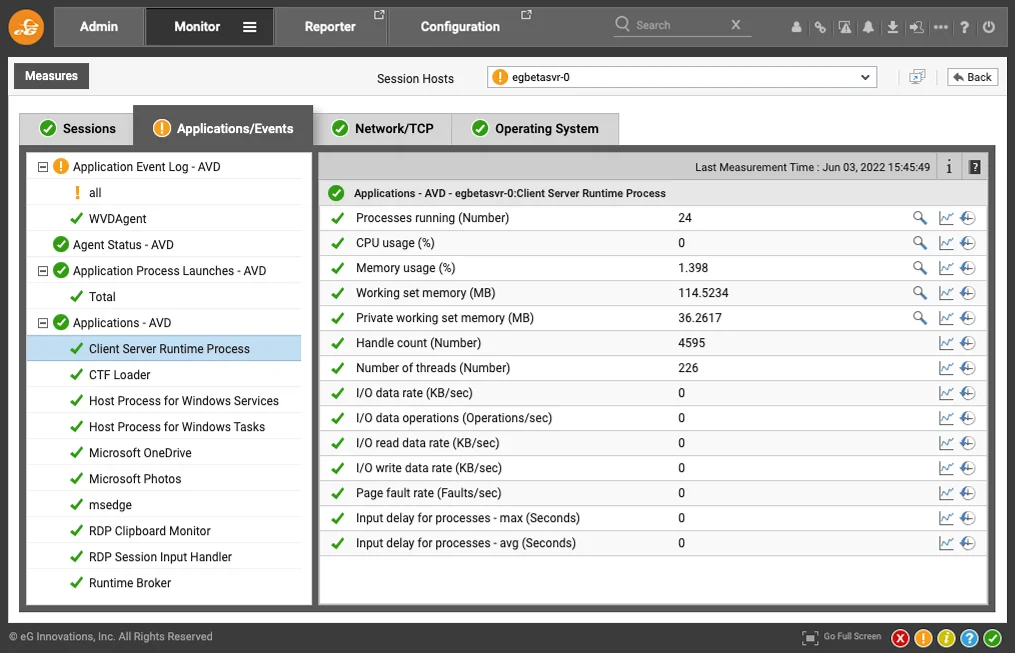
And finally, you can even easily navigate into the performance and resource consumption of individual applications! For example, in the below screenshot I'm looking at the metrics of Microsoft Edge.

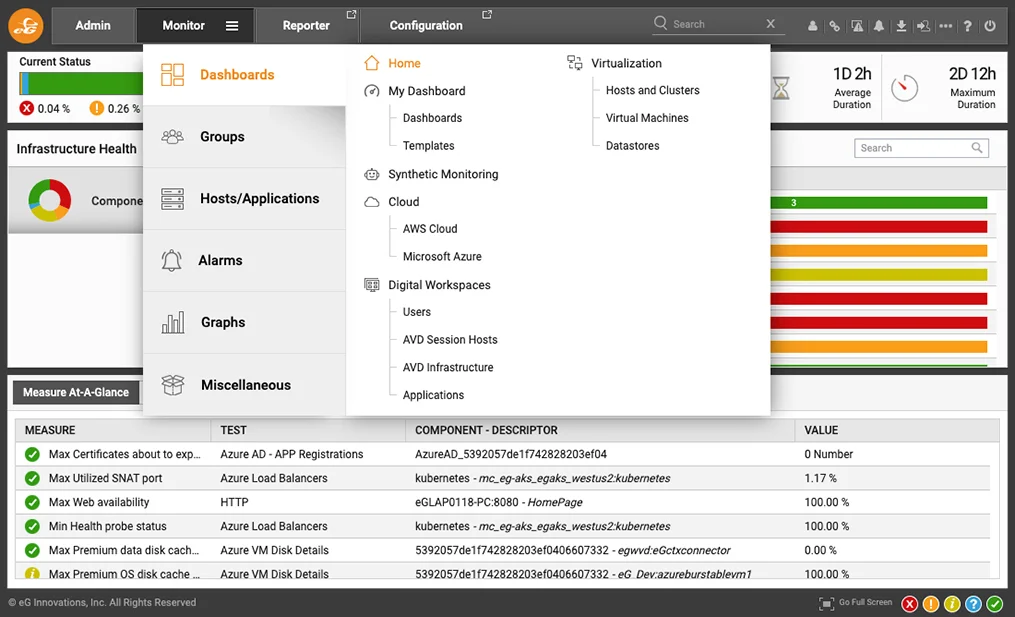
Using the top bar menu, you can further drill into the Azure Virtual Desktop environment.

AVD High Level Overview
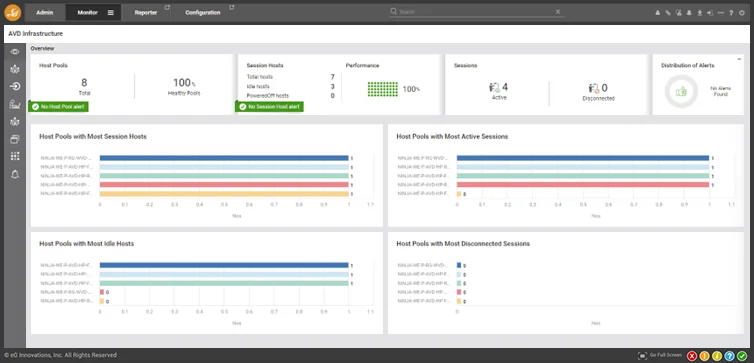
The overview page provides you with a high-level overview of your host pools. It includes information like the number of host pools, the health, and session information per host pool. Again, all of these can be drilled down into by simply clicking on them.

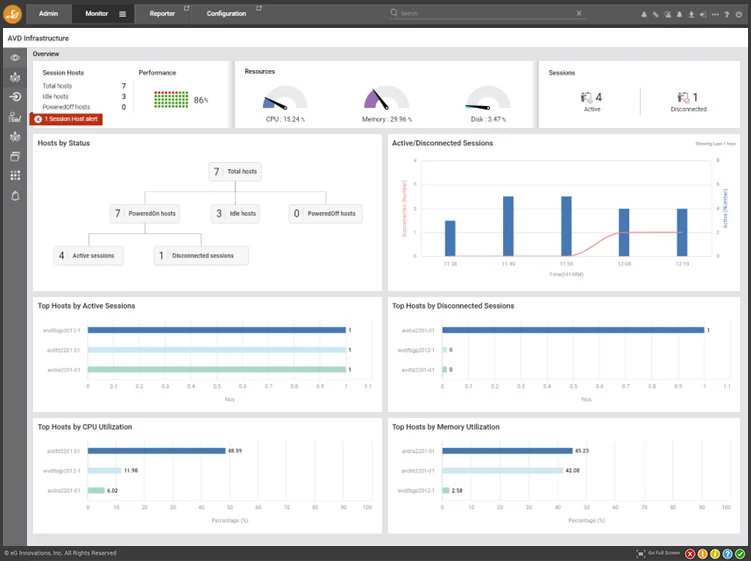
The session hosts tab provides you with a clean summary of the environment. Showing the overall resources consumed, a status per host and information related to active and disconnected sessions.

Again, the console makes it very intuitive to drill down into the performance per individual user showing details like logon duration, round trip latency and bandwidth consumption.

Detailed User Session Telemetry
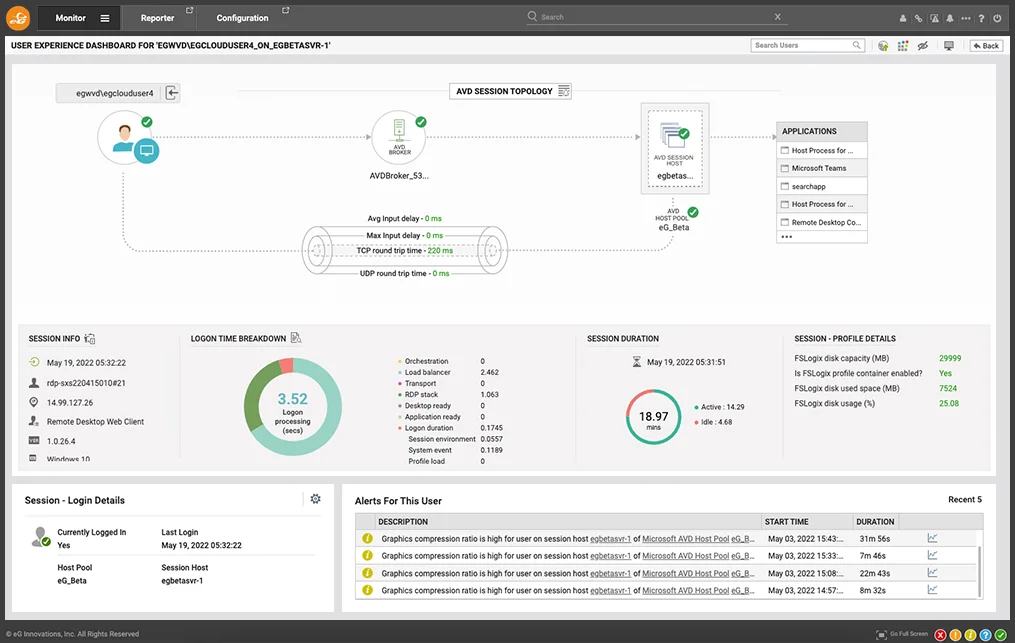
Clicking on a specific user provides even more details about the user session. You are presented with session information containing the users IP address, client version, a break down on the logon sequence, and even information on the FSLogix disk usage in the lower right corner.

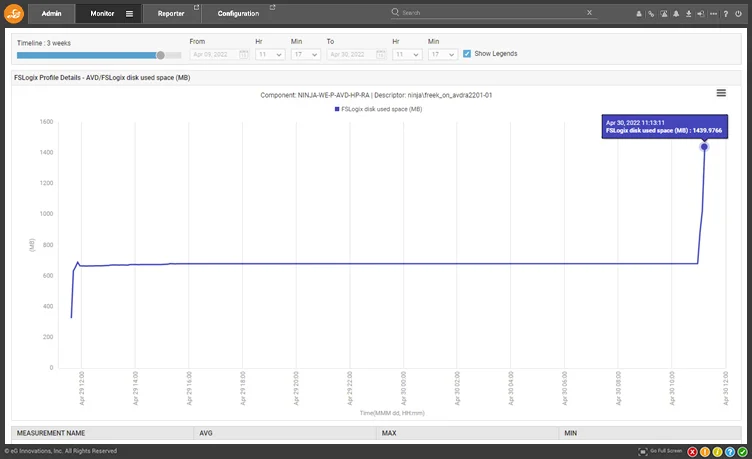
Again, what I personally really like about eG Enterprise is how almost anything allows you to drill down further and see historical information or discover trends. There are too many scenarios to show here, but for example clicking on the FSLogix disk space, the diagram below shows the growth of the FSlogix Profile Container over time.

On that same page, you can also view more details on the consumption per process for this specific user.

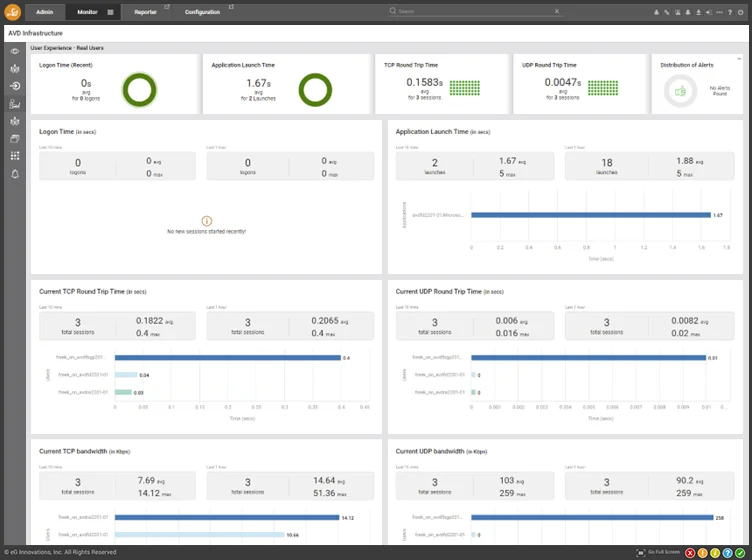
The User Experience tab provides a higher-level overview. In this case for example, I have three active sessions from the same client located West Europe. You can clearly tell one of these three sessions is connected via an Azure Virtual Desktop Control Plane in another region, in this case East US.

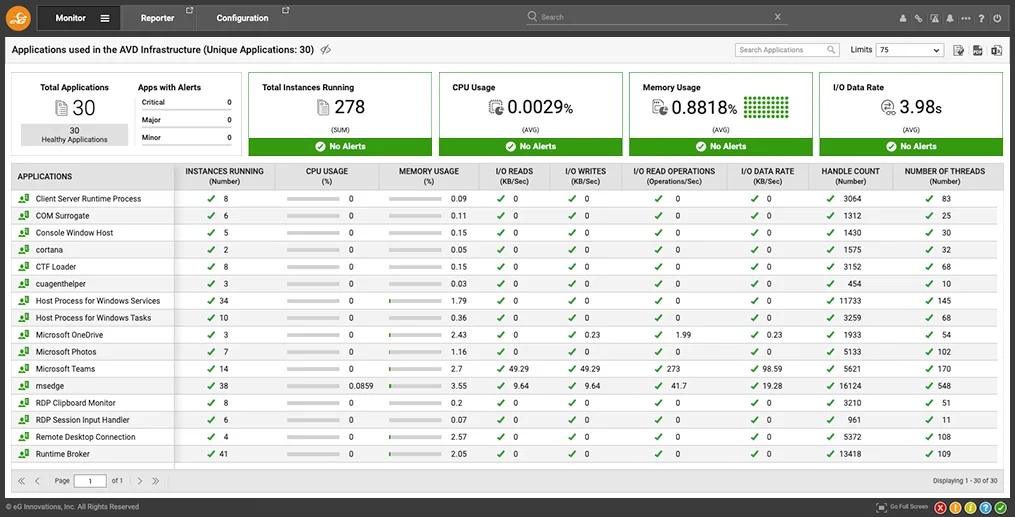
Besides all this information per user or per host pool, sometimes you also want to view details on applications across all your environments. This is exactly what the Applications tab contains. The overview below contains the number of instances per application as well as great details on the resource consumption!

Azure Environment
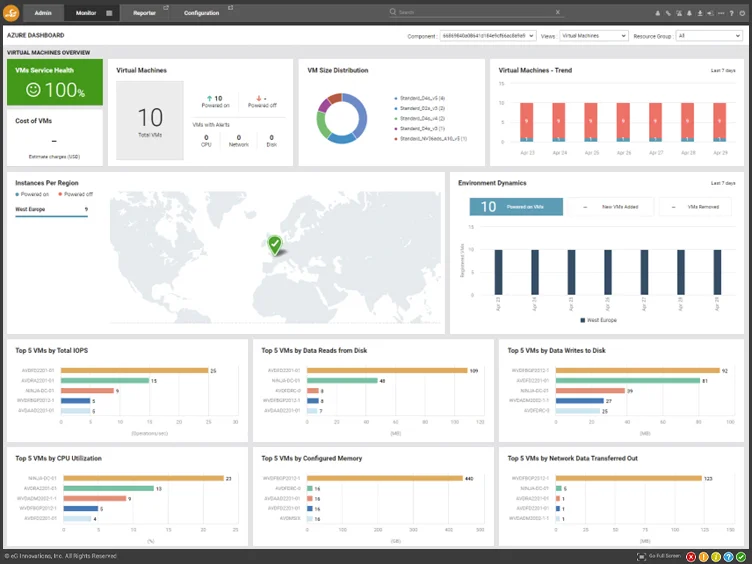
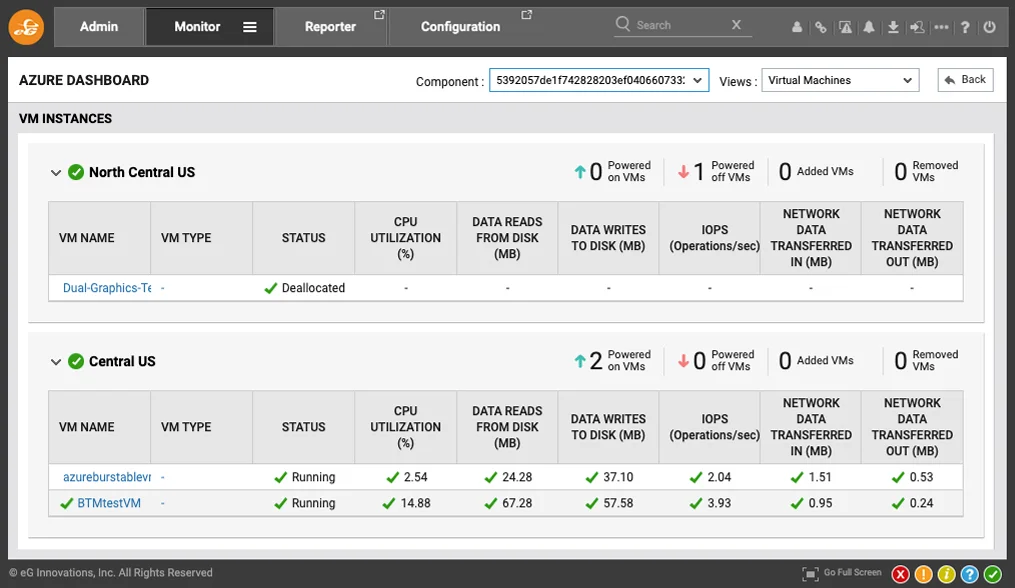
As addressed earlier, eG Enterprise goes beyond the monitoring of Azure Virtual Desktop and is truly end-to-end. The screenshot below shows how eG Enterprise also includes telemetry and health about your Azure environment! For example, you can see the number of virtual machines, their size, location, and SKU. But interestingly also the trend of the virtual machines. This allows you to easily spot changes in number of virtual machines over time as well as gain information on how many of those were powered on and what the top5 trend is in terms of performance. All this information can of course also be found throughout various places in the Azure Portal or using Azure CLI, but the way eG Enterprise brings this information together in a single pane of glass including trends and environment dynamics, which makes it super easy to digest!

Again, the diagram is also highly interactive. As shown below, you can easily get insights in the performance metrics for all virtual machines to spot issues or configure alerting based on thresholds.

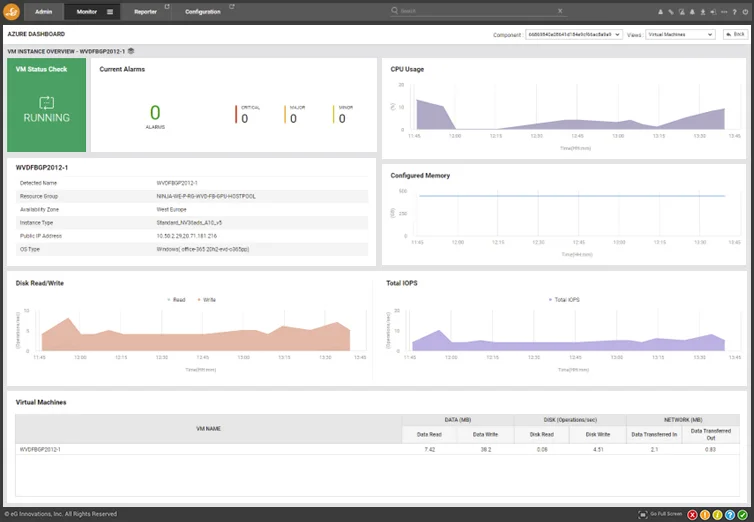
Going one level deeper you are presented with even more details about current performance as well as trends about a single virtual machine.

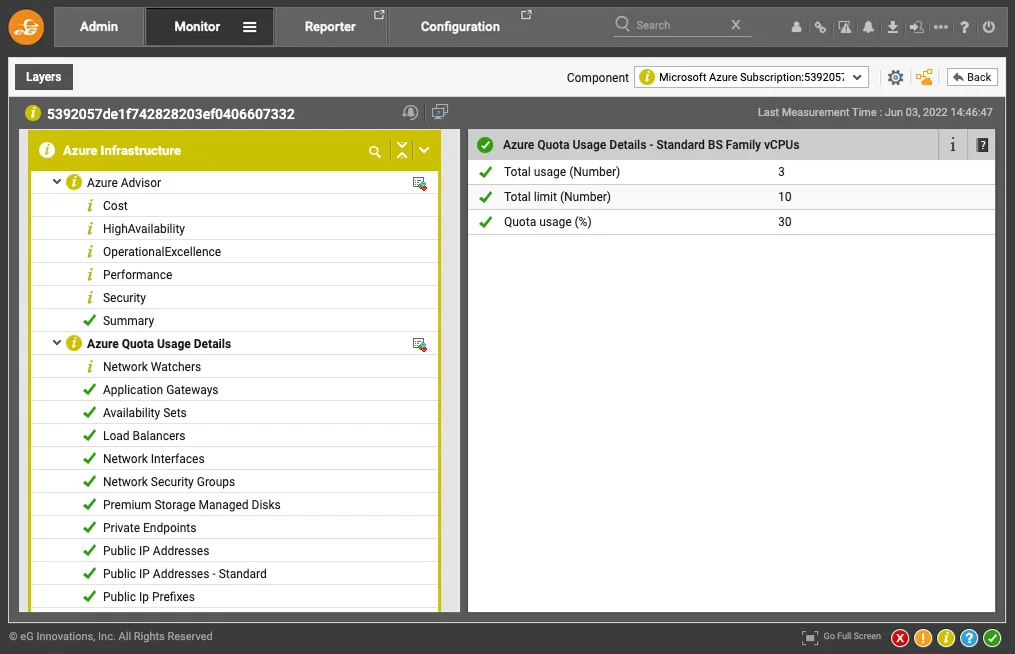
Azure Quotas are typically also something you have to deal with in larger environments. Insights on these quotas are made easily accessible in the console as well. For example, here is the current quota of the NVADSA10v5 Family vCPUs I have running as part of the A10 GPU public preview.

Azure Active Directory
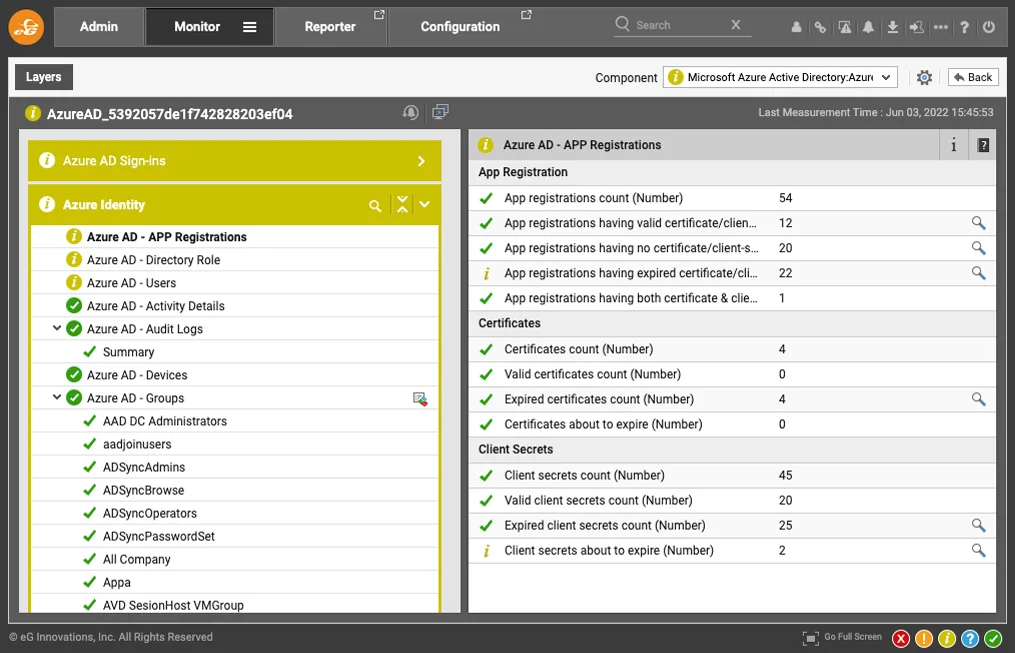
You can also perform in depth monitoring of Azure Active Directory administrative activities. This allows you to keep track of activities and send alerts on suspicious activities related to objects like users, groups, or app registrations.

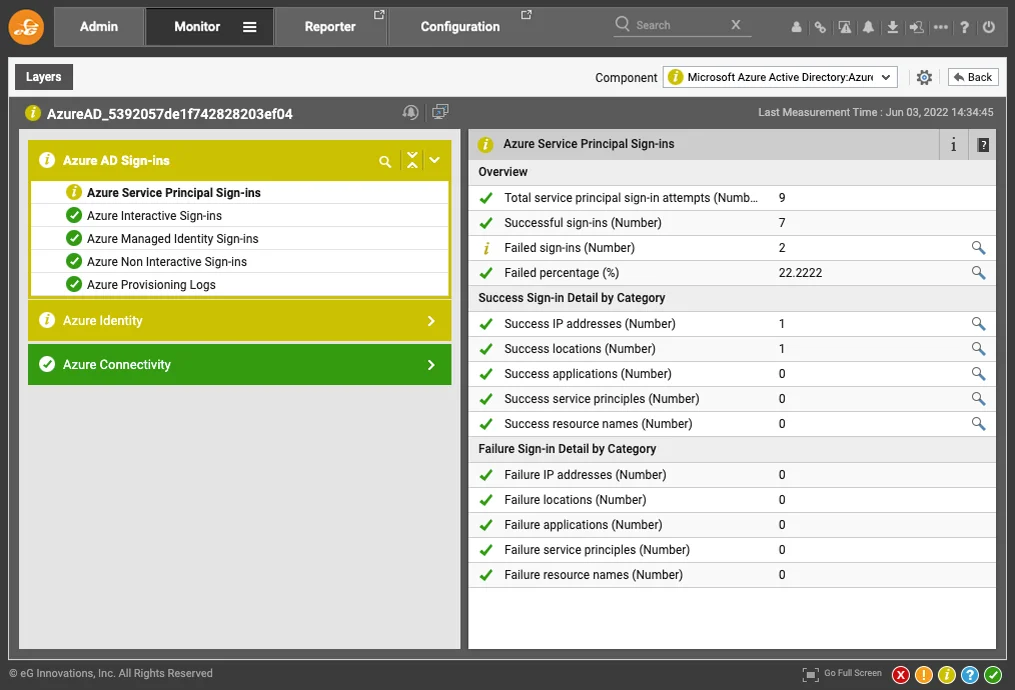
This also includes Azure Active Directory Sign-in activities as shown below.

The power behind eG Enterprise is that it really allows you to monitor the entire Azure Virtual Desktop stack to achieve end-to-end monitoring. Besides the Azure Virtual Desktop, Azure Infrastructure and Azure Active Directory components you can also add any other service you want to monitor including any SaaS, IaaS, virtualization platform or backends you might be running. For many of those eG Enterprise provides an agentless approach, but where needed, agents for various platforms are also included.
Reporting
Interactive dashboards are great, but a monitoring solution is not complete without reporting functionality. Being able to automatically generate and distribute reports on the usage, uptime and performance of your environment is critical. eG Enterprise comes with a wide variety of different types of reports out of the box. Executive, operational, analytics or domain specific, they are all included. Let's cover some Azure Virtual Desktop specific examples.
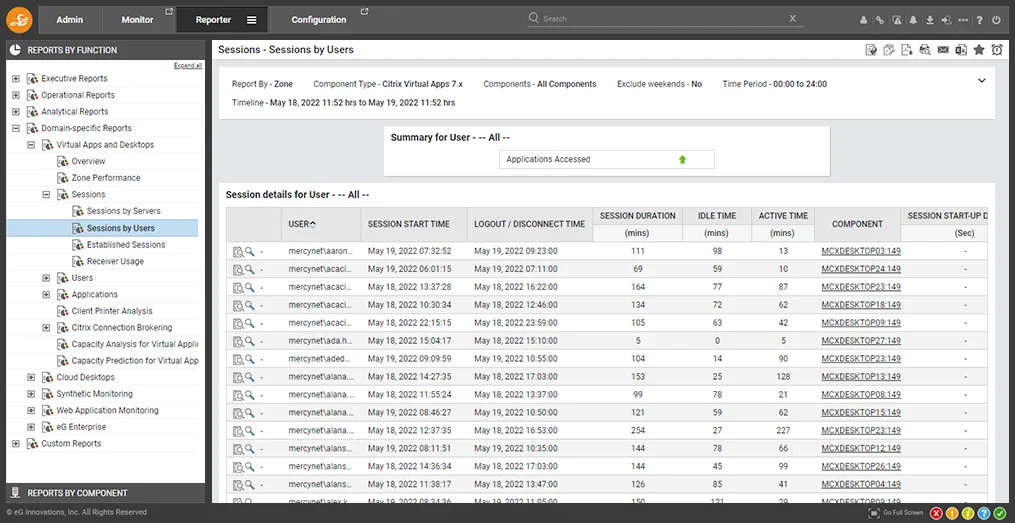
The report below provides details on the usage of Azure Virtual Desktop. It answers questions like who logged on? For how long? What was their average resource consumption?

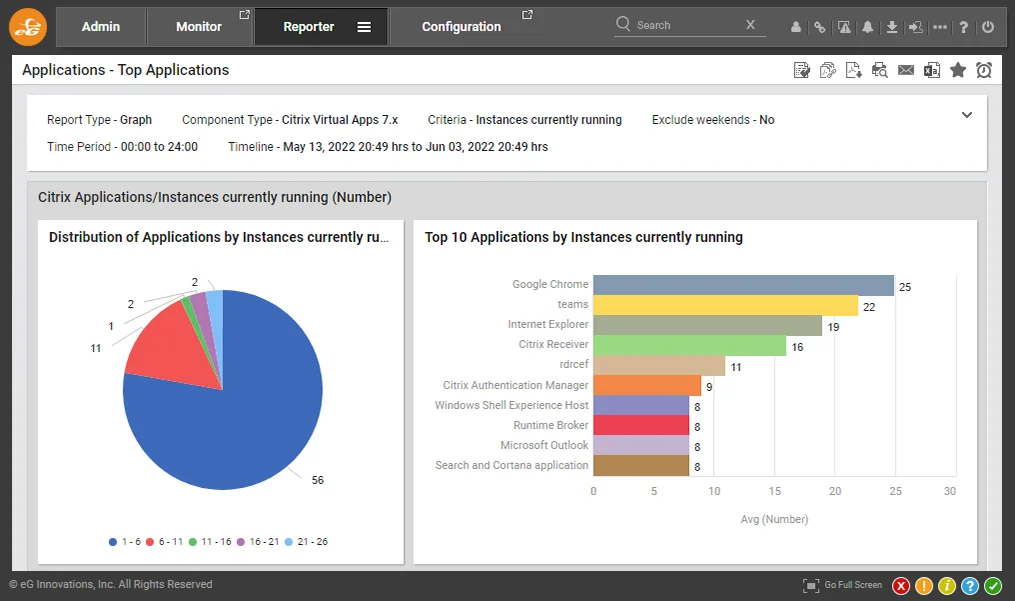
Furthermore, the reports below show you the top 10 applications being used. These reports can be run on various levels, per broker, per host pool, and per session host.

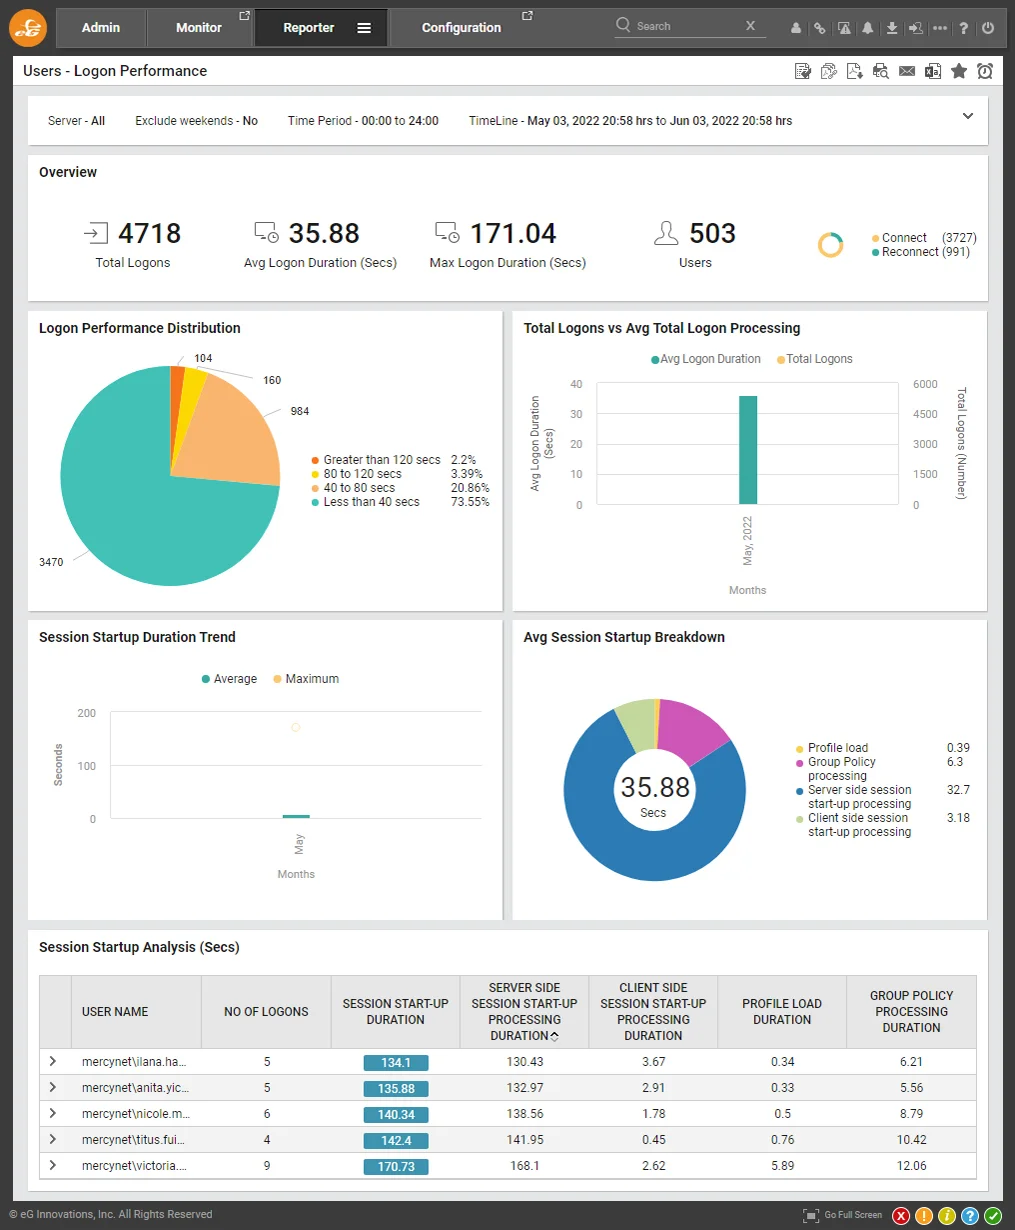
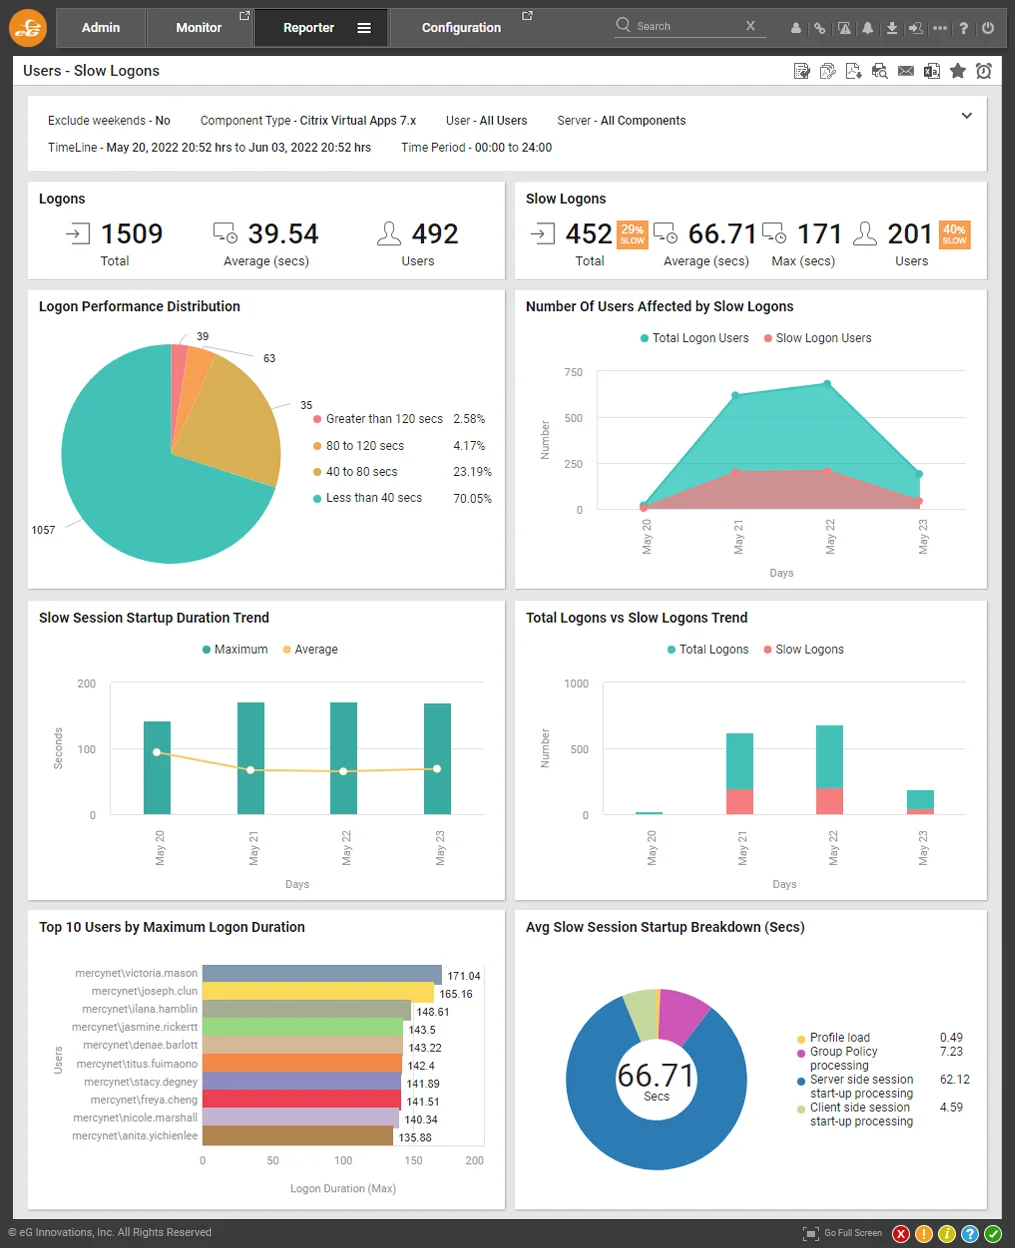
A very useful report is one related to logon performance. The report below shows you the average logon time during a specific time range, a logon process breakdown as well as detailed analytics of each logon step.

More specifically, you can also generate a report that focusses on slow logons over a period of time. This allows you get insights in where and when slow logons occurred and more importantly, drill down to perform a root cause analysis.

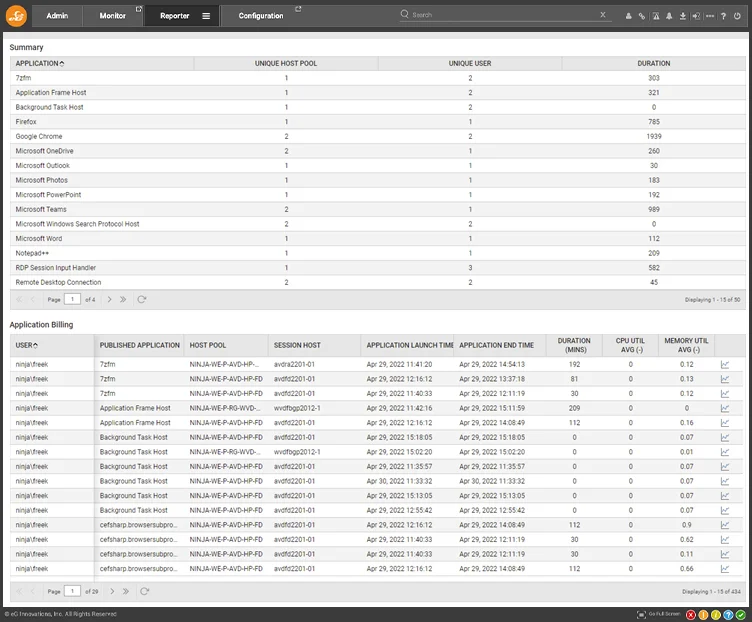
You can also gain detailed insights on the usage per application to find out how often, how long, by which user, and on which session host a specific application was used.

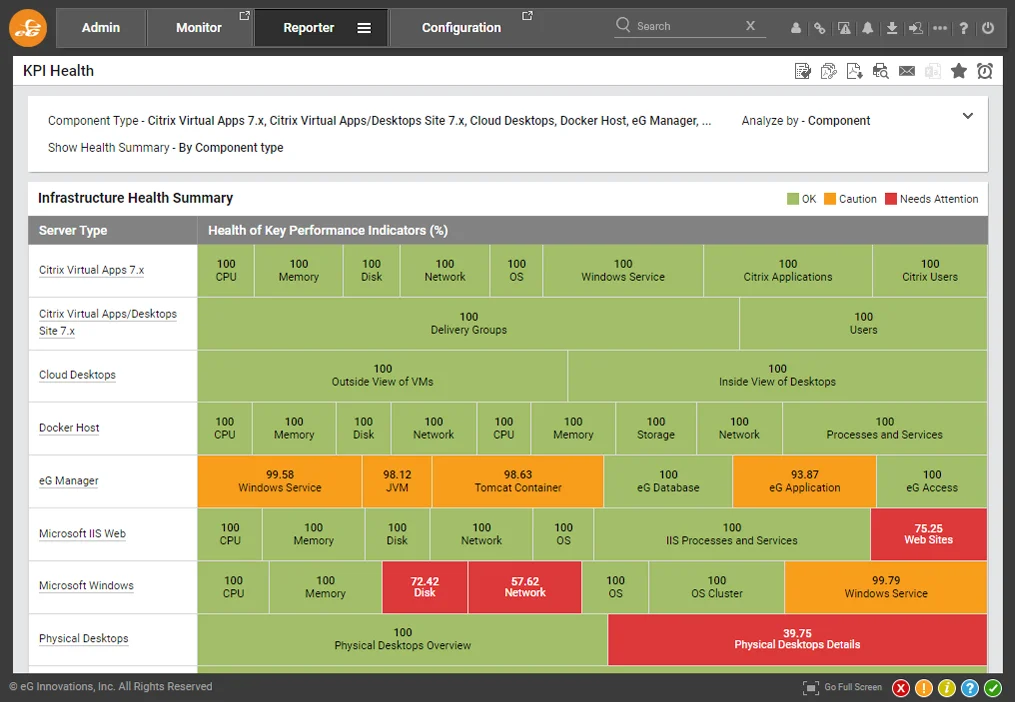
More high level executive KPI reports are also possible. For example, the report below which shows the health of all components in the stack.

All of the reports are customizable including the ability to create full custom reports, and you can also create your favorite reports, exports them to pdf, or automatically generate & email them periodically.
Logon Simulations & Synthetic Users
eG Enterprise also provides synthetic monitoring solutions that allow you to proactively test, detect, and diagnose problems. A variety of synthetic monitoring functionalities, and logon simulations are provided. You can use synthetic monitoring to baseline the performance and user experience to identify changes in the future.
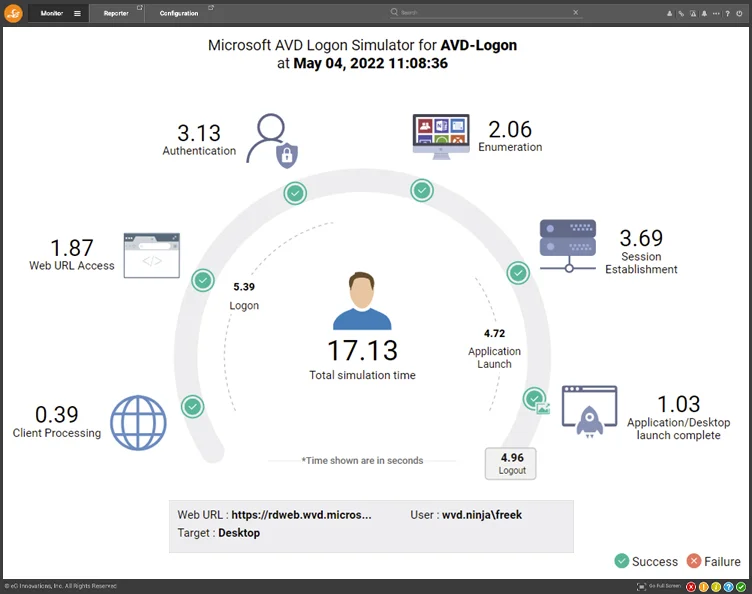
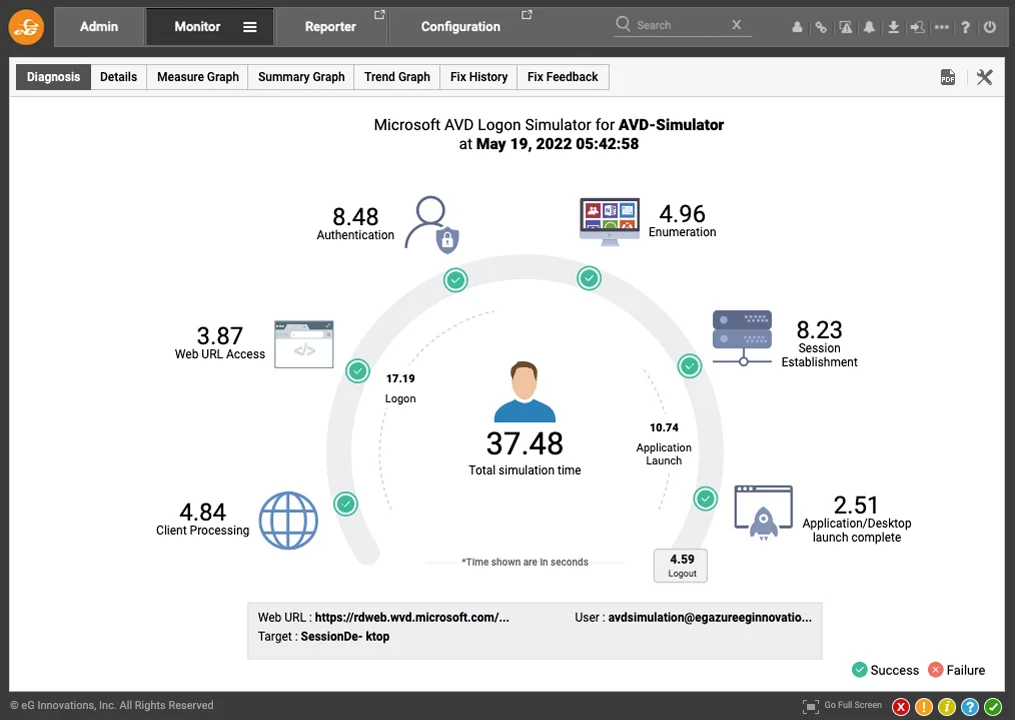
The screenshot below shows the result of a logon simulation test for Azure Virtual Desktop. I really like the way eG Enterprise presents the information of the logon sequence showing each logon step, and the duration of each individual step.

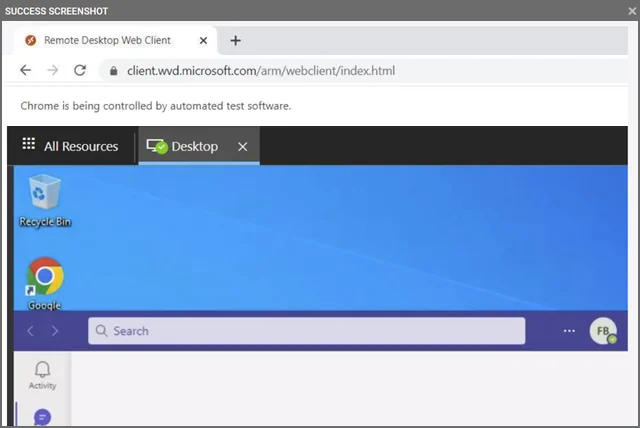
Note that the last step 'Application/Desktop launch complete' shows an image icon, upon clicking that icon, a screenshot is presented showing the actual output, the perceived end user experience!

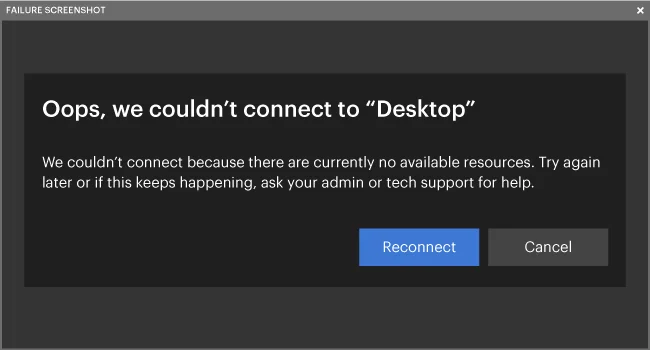
A great way to confirm a successful test, but of course the real value is also being able to see the result in case of an unsuccessful test. For example, if no Session Hosts are available in the configured host pool, the 'Session Establishment' step obviously fails.

And the collected screenshot clearly indicates the reason!

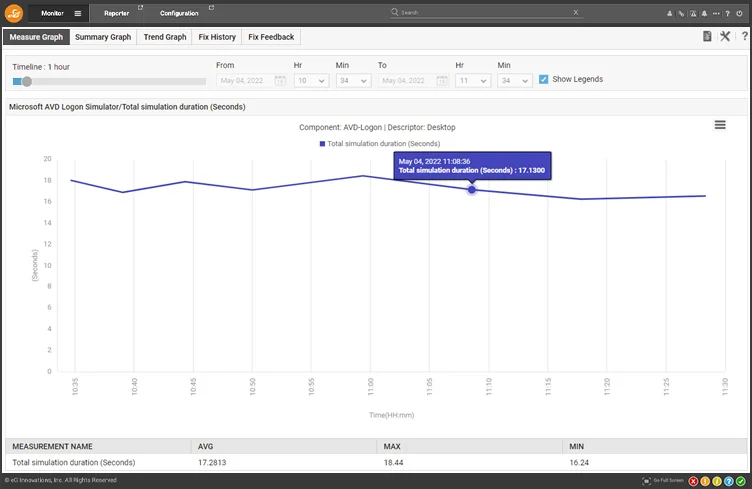
Once you have a baseline test, you are also collecting historical information. For example, the screenshot below shows the test duration over a period of time.

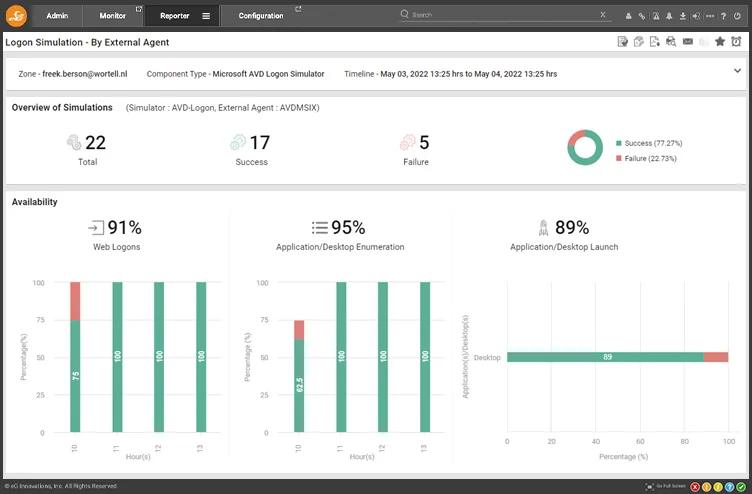
And finally, you can also create reports on logon simulations. The report below is per external agent and shows successful and failed logon simulations over a period of time.

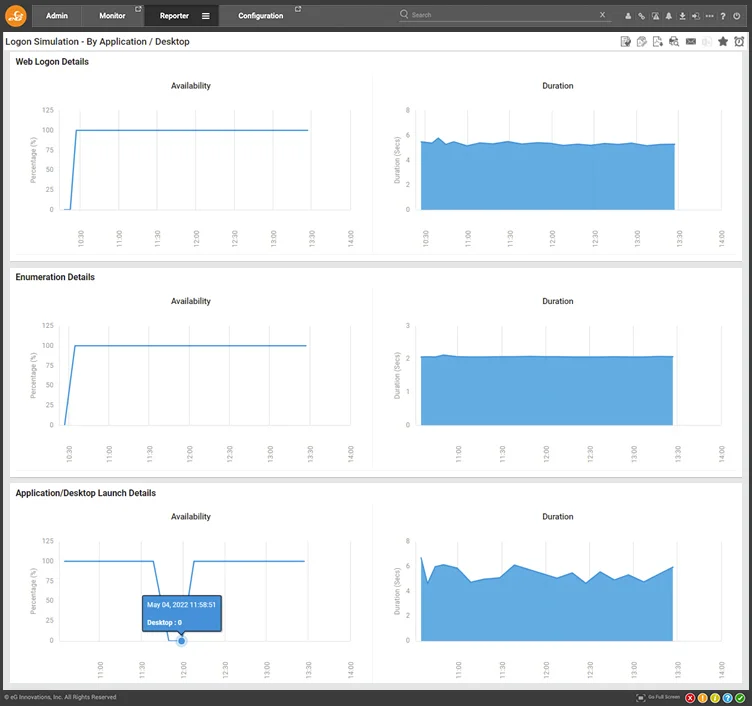
A report by Application/Desktop is also possible. The report below shows the availability of each individual step. Notice the unavailability inside the Application/Desktop launch diagram. That was during the test described earlier where all session hosts were set in drain mode.


Summary
I'm impressed what eG Enterprise has to offer in end-to-end monitoring for Azure Virtual Desktop. The auto discovery capabilities, including out of the box thresholds, allow for easy and fast configuration. Getting detailed insights in logon duration, application launch times and the perceived end user experience is great. The ability to gather load simulation tests details using a synthetic user is super helpful and the way they are displayed in the console is great. eG Enterprise goes beyond monitoring Azure Virtual Desktop only, with the ability to also closely monitor all surrounding infrastructure like Azure, Azure Active Directory, Active Directory Domain Services and any application backend. This makes eG Enterprise truly end-to-end. The reporting capabilities provide highly detailed as well executive level health overviews of your entire environment and can be created periodically in an automated way.
Stay tuned for more news from eG Innovations on eG Enterprise 7.2 and monitoring Azure Virtual Desktop! I want to thank eG Innovations for providing the opportunity to test drive this functionality during preview!
For more information on eG Enterprise for Azure Virtual Desktop visit eginnovations.com/azure-virtual-desktop-monitoring-avd


