If you have experience supporting Citrix environments, you will know that often without specialized products, it is difficult to effectively and proactively monitor and troubleshoot issues when they happen. Time to find the root cause of an issue is exacerbated because you often don't have a single tool to feed you with all the right information you need, but rather you have to use multiple tools each of which gives you parts of the picture and you are required to piece everything together. This not only makes troubleshooting time consuming and cumbersome, but you need to have expertise in the Citrix environment to be effective.

eG Enterprise is an end-to-end digital workspace monitoring solution from eG Innovations that can monitor the Citrix Virtual Apps and Desktops stack of components, and Citrix DaaS, providing complete end-to-end visibility into the environment. This makes the life of a Citrix Administrator easier due to the aid of a product which has been developed over many years and understands how the core Citrix components work and should behave, including the supporting services that are just as important to have working optimally to provide a great end-user experience.
Although eG Enterprise has a number of different capabilities including monitoring of web and Java applications, Microsoft Office 365 and SaaS services, SAP and other enterprise applications and so on, this review only focuses on eG Enterprise for digital workspace monitoring. Furthermore, I have evaluated and tested the solution for monitoring a Citrix digital workspace only and although eG Enterprise offers similar capabilities for VMware Horizon and now supports multi-session Azure virtual desktop as well, those are not covered in this review.
I have known eG Innovations for several years as one of the leading third-party monitoring options for Citrix virtualization environments. Citrix to date has not had a unified strategy for monitoring, which is reflected by the different tools which are available - Director, Analytics, ADM, etc., and as a result, no single pane of glass that would otherwise make it easier to troubleshoot. eG Enterprise value adds by offering simple views to the helpdesk, by integrating with service desk ticketing systems, and by providing topology views to drill down into each tier and provide in depth insights that even Citrix experts may find useful and complimenting. I was curious what new capabilities had been added to eG Enterprise v 7.2 and this review discusses what I found including how it can help you in your Citrix VAD or DaaS deployments.
New Citrix monitoring capabilities in eG Enterprise v 7.2
| 1 |
Logon simulator enhancements
|

The Logon Simulator acts as a synthetic monitoring tool, launching connections to your Citrix published applications and desktops in the same way as a real user through the likes of Citrix StoreFront and Gateway. This is handled by a lightweight eG Agent that runs on a designated simulation machine.
If the simulator detects a problem, e.g., an application cannot be started, or a login takes a long time, then the detail of the problem is fed into the eG Manager dashboard, including any appropriate alerting to be flagged to the Citrix Administrators supporting the solution.
The following enhancements have been made to the tool in this release.
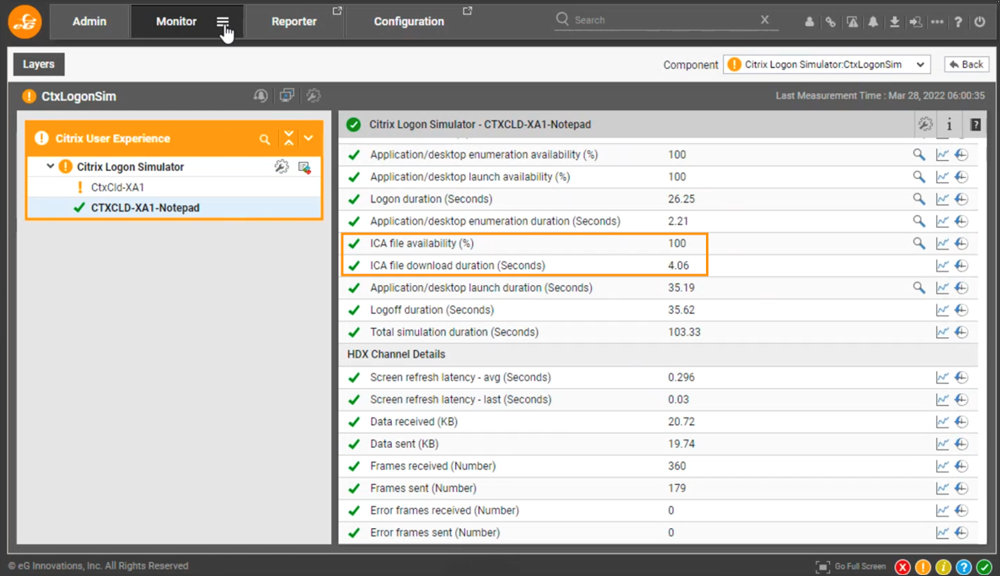
- ICA file download time is now captured. As a user requests to launch an application or desktop, the time it takes to download the ICA file is now captured separately to the other metrics, as shown in the below screenshot. This can help IT administrators identify if there is with Citrix StoreFront, or a network issue between the end-users' client device and StoreFront, for example.

- Additional HDX session metrics are now reported as part of the logon simulation. With this enhancement, you are able to be made aware of high latency within a session, rather than just be alerted on the typical logon performance metrics.

- Session idle time can be configured during the simulation, allowing you for example to set a delay before launching an application during the simulation. By default, the value is 90 seconds, but this can be changed.
- Two factor authentication support for Microsoft Azure using Time-based One Time Password (TOTP). This way if your Citrix Gateway, or Citrix Workspace is protected by TOTP based MFA, you can configure the logon simulation to simulate this step by automatically generating a TOTP passcode and submitting it into the respective logon field.

- Support for Citrix Workspace configured to use an on-premises Citrix NetScaler as the identity provider. For customers who delegate authentication to their on-premises Citrix Gateway, the logon simulator can support this flow and still capture all of the same metrics as before.
The Logon Simulator is fully integrated into the eG Enterprise web console, so you don't need a separate login or view to access simulation metrics vs. real metrics from your infrastructure. If you are a service provider with multiple customers, you may be able to use a single simulator to monitor multiple customer farms (the simulator cycles through the farms one after the other). You also have the ability to deploy simulators in multiple locations to get different views of performance.
| 2 |
Citrix cloud monitoring enhancements
|

Citrix Cloud comprises of several services that enhance the digital workspace, and which are managed by Citrix. One of the most common services used by organizations today is Citrix DaaS, formerly the Citrix Virtual Apps and Desktops service. eG Enterprise monitors the Citrix cloud control plane in an agentless manner by connecting to OData API endpoints.
OData updates
eG Enterprise has been updated to use region-specific OData API endpoints for Citrix Cloud monitoring, including using OAuth 2.0 for improved authentication and authorization. This is consistent with how Citrix has changed their cloud architecture - for scalability and efficiency.
The region-specific OData API endpoints used by the product are:
- US Region. api-us.cloud.com/monitorodata
- EU Region. api-eu.cloud.com/monitorodata
- AP-S Region. api-ap-s.cloud.com/monitorodata
Cloud connector monitoring
The Cloud Connector is one of the most important components in a Citrix DaaS deployment, and it is hosted within the customer's resource location on a virtual machine running Microsoft Windows Server OS. Thus, it is essential that you monitor your Cloud Connector servers.
If the Cloud Connector encounters any issues or runs slowly, session performance could be impacted depending on the setup, as well as authentication, provisioning, power management, and other tasks that the Cloud Connector is responsible for.
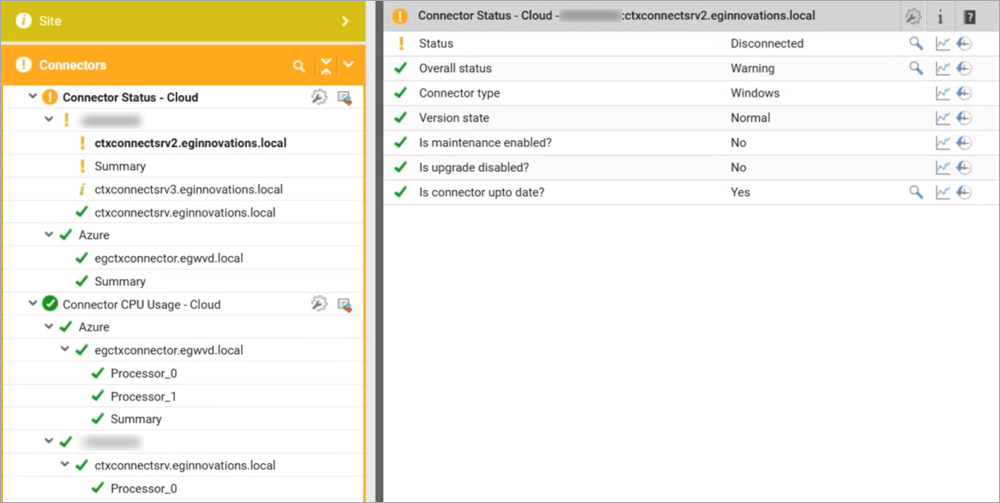
With the latest release of eG Enterprise, you can now get insights into the Cloud Connector performance without having to install the eG Agent on each Cloud Connector, as the product pulls this information directly from Citrix Cloud and displays the information within the eG Enterprise console.

eG Enterprise displays the overall health status of each Cloud Connector, if maintenance mode has been enabled, if the Cloud Connector is up to date, and other useful pieces of information such as CPU, Disk, Network, and Memory utilization.

This can be particularly useful if the Cloud connector is a Linux appliance, where you may not want to deploy an agent for monitoring.
| 3 |
Auto-correcting registration issues in Citrix virtual apps and desktops
|
It is quite common for Virtual Delivery Agents (VDAs) to be in an Unregistered state, especially if your Citrix deployment scales to hundreds of virtual machines.

If a VDA is in an unregistered state but should not be, then this machine will not be able to accept any user connections. This could be a problem if you have a very small number of VDAs in a Delivery Group, or if the desktops are statically assigned to individual users. Thus, you need to be informed without delay so that you can take corrective actions.
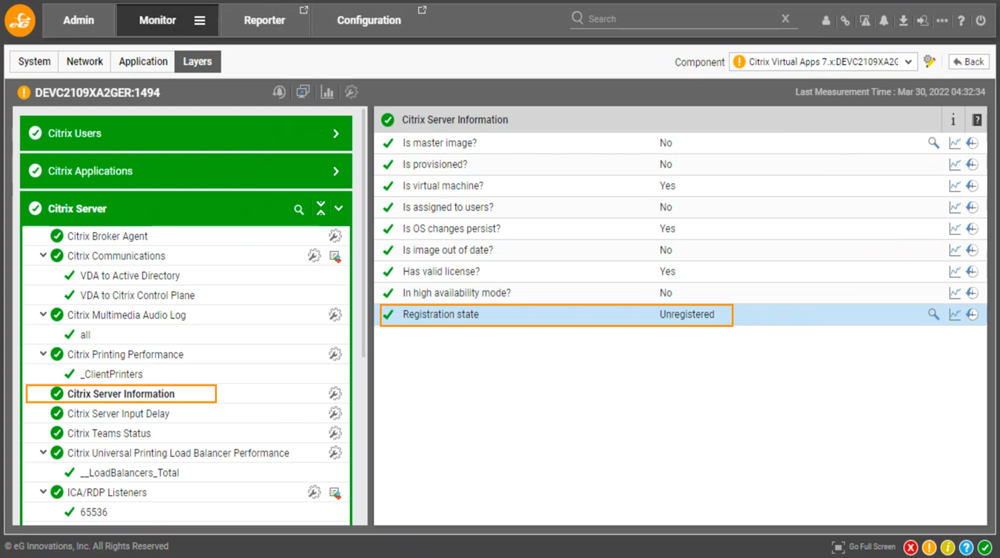
eG Enterprise now includes a 'Citrix Server Information' report for each monitored VDA that provides details on the registration state.

Further, eG Enterprise can be configured to instruct the eG Agent to take action to resolve the registration issue automatically by restarting the Citrix services on the machine, or the machine itself. The eG Agent performs a service restart first and only if that does not correct the issue will it restart the virtual machine, provided you have set both options to Yes.

| 4 |
NetScaler gateway monitoring enhancements
|
Availability and responsiveness
For remote working, users typically rely on a NetScaler Gateway to provide secure access to Citrix Virtual Apps and Desktops.

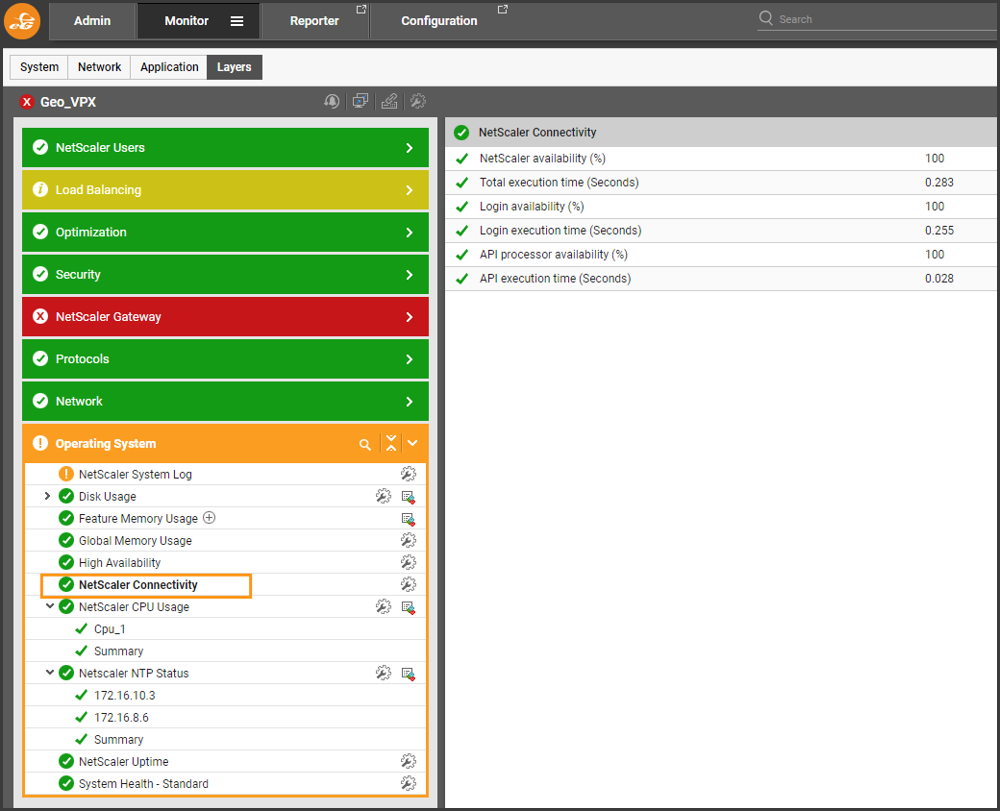
The 'NetScaler Connectivity' test that eG Enterprise executes against a monitored NetScaler gives insight into the availability and responsiveness using an API check to help detect when a NetScaler is responding slowly or is completely unavailable.

NetScaler system log monitoring
As NetScaler logs events to the system log, eG Enterprise can now monitor this using the ADC NITRO API, providing agentless monitoring for critical events like when the NetScaler goes DOWN.

You can click into the events and get further detail on what exactly went Down, for example. It could be an individual backend service, or a virtual server.

| 5 |
Automated ways of deploying agents
|

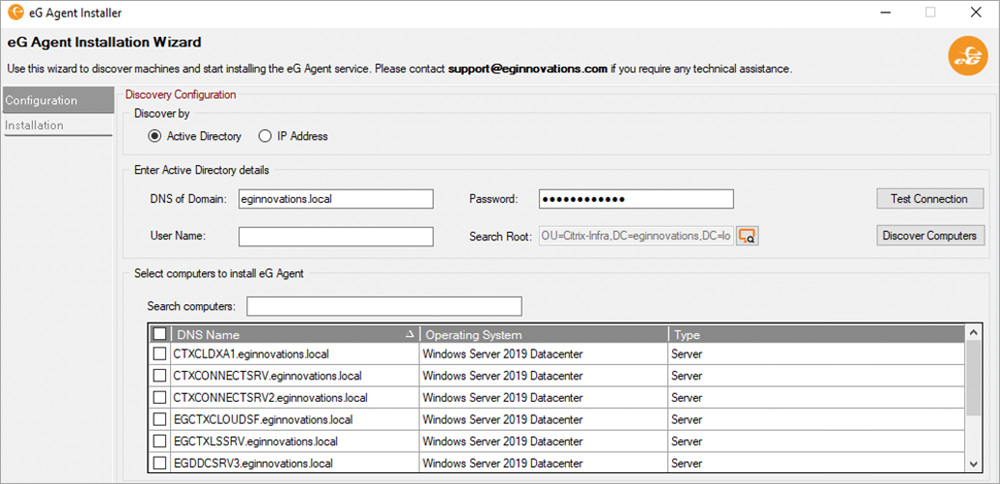
Agents are needed to monitor other key Citrix components - StoreFront servers, virtual app servers, license servers, Delivery Controllers, profile servers, etc. Previously manual effort was required to install the agent to such components for example by automating the installation through Group Policy or SCCM, but now eG Enterprise offers different ways of pushing agents out automatically from one place, the eG Manager. For example, under the Enterprise Deployment Model where eG Manager is internal to your organisation, you can push agents from the manager to your target Windows based systems. If leveraging the SaaS Deployment Model where eG Manager is cloud hosted, you can download agents and the installer from the manager to an on-premises system, and then use the installer to push agents to your target Windows based systems.
After downloading the agent, you discover the target systems you want to deploy the agent to either by using Active Directory or specifying individual, or a range or IP addresses.

| 6 |
Multi-tenancy improvements
|

eG Enterprise supports both on-premises and SaaS deployment models. In the SaaS deployment model, a customer can download and install agents. The download screen provides the option to deploy agents and when you download the agent, auto-discovery ensures that your applications/devices are automatically mapped to your account. Citrix service providers looking to offer managed services will find this very useful. Whilst the eG Manager is shared, multiple organizations can be created for each of your customers, and you create separate logins for each customer. If a customer logs in using their own login to the shared eG Manager under the SaaS model, their set of components are visible, but not anyone else's. This provides the right level of isolation needed under the multi-tenancy model to support multiple customer deployments and grant access at a customer-level, without needing to manage disparate deployments of eG Enterprise.
| 7 |
Microsoft teams optimization pack monitoring
|

Citrix have jointly developed with Microsoft the Microsoft Teams Optimization Pack (MTOP) to offload Microsoft Teams based audio and video processing to the user's endpoint. This capability reduces the CPU processing and bandwidth that a Virtual Delivery Agent needs to handle and improves the quality of Microsoft Teams audio and video calls for a richer end-user experience.
There are times when the optimization does not work as expected, and processing has the potential to fall back to being processed on the VDA itself. In such scenarios it would be useful to know if the Teams client running within the Citrix virtual desktop is HDX Optimized or not, but it is not easy to tell this without the right tools.
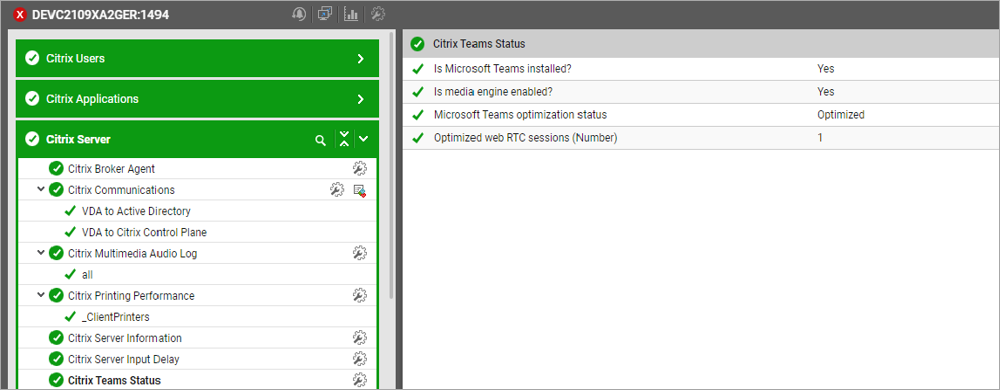
Now, with eG Enterprise you can get a simple report that confirms the status of Microsoft Teams on each monitored Virtual Delivery Agent. From a simple view you can tell if Teams is installed and if so, is the optimization is working as expected and how many sessions are currently optimized. You can also get the Teams version on each monitored machine by viewing the detailed diagnosis.

| 8 |
Latency monitoring between Citrix tiers
|
Did you see my recent article around Citrix latency and why it is important to monitor it? If not, you can check it out here.

Latency is one of the common causes of the 'Citrix is Slow' complaint you may be familiar with hearing during your time supporting a Citrix environment. Because there are many components involved with a typical Citrix Virtual Apps and Desktops deployment it can be hard to track where exactly latency is coming from, especially if you don't have visibility into the Network, Storage, or Compute infrastructure, for example.
To help combat latency, catch it early and find root cause quicker, eG Enterprise now integrates with Windows Resource Monitor to track latency between the different Citrix tiers.

Now you can track latency between the following paths between tiers:
- Citrix Virtual Delivery Agent to Active Directory.
- Citrix Virtual Delivery Agent to Delivery Controller for on-premises deployments.
- Citrix Virtual Delivery Agent to Cloud Connector for DaaS deployments.
- Citrix Delivery Controller to License Server, Active Directory, and Database.
- Citrix Cloud Connector to Citrix Gateway service and Citrix Cloud control plane.
- Citrix Provisioning to License Server and Database.
| 9 |
Monitoring white-listed client applications
|

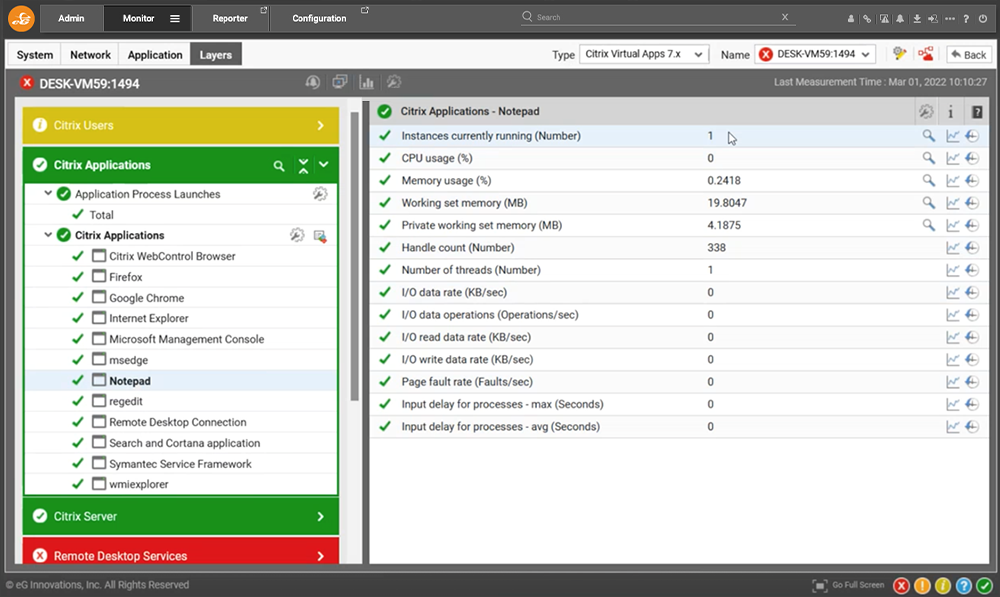
For each Citrix session on a Citrix Virtual Apps server that eG Enterprise monitors, the product can monitor all of the client applications launched within the session.
This is useful when tracking who is launching what, and what the performance characteristics such as CPU and Memory usage is, but you might not be interested in seeing this information for every single application since all users could launch many different applications.

To control the applications that are monitored, you can now define a 'WhiteListProcesses' entry within an eG Manager configuration file, specifying the applications you want to monitor. Then, by switching the 'Show Only Whitelist Apps' option to 'Yes', you will be instructing eG Enterprise to monitor and show data for only those applications.

| 10 |
Linux VDA/VDI monitoring enhancements
|

Citrix has added new performance values on Linux VDIs to allow per user session metrics to be collected. eG Enterprise can now also monitor user session performance on Linux VDA/VDI. This allows organizations to deploy applications optimized for Linux OSs to users using mobile, Mac, Windows, and BYOD (Bring Your Own Device) endpoints as well as those using native Linux.
Importantly, eG Enterprise is using a lightweight bespoke VM agent, designed specifically for this use case, installed as a Linux service which can be configured in pull or push mode this means no need for credentials per VDI and ultra-fast connections, scalable to 1000s of VDIs. Many products' Linux support is limited to SSH mechanisms which have proved problematic around security but also scalability.
| 11 |
Remote control enhancements
|
A lot of enhancements around Remote Control Actions have been added in this release of eG Enterprise.

Remote Control Actions can assist in scenarios where the IT user does not have direct access to the system being monitored, but still should be able to take actions such as restarting a VDI desktop that perhaps has hung, capturing a screenshot of a user's session where an error message may be present, shadowing of a user's session to provide technical assistance, or logging off disconnected sessions from a session host to free up resources.
In such cases, the eG Agent can issue interactive or background commands on the Citrix Virtual Apps or Desktops server.
New remote control actions
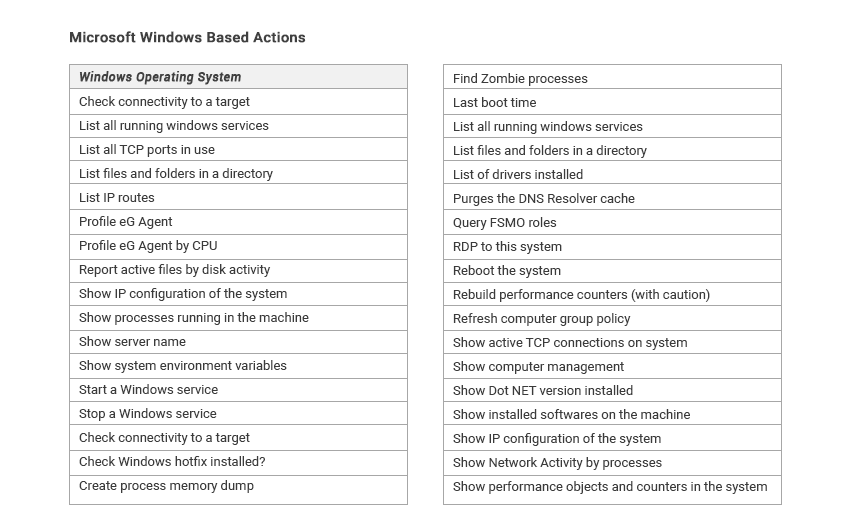
With this release, a lot of new actions have been added to the product which empowers the IT user to further support the end-user and reduce the amount of time it takes to troubleshoot issues.

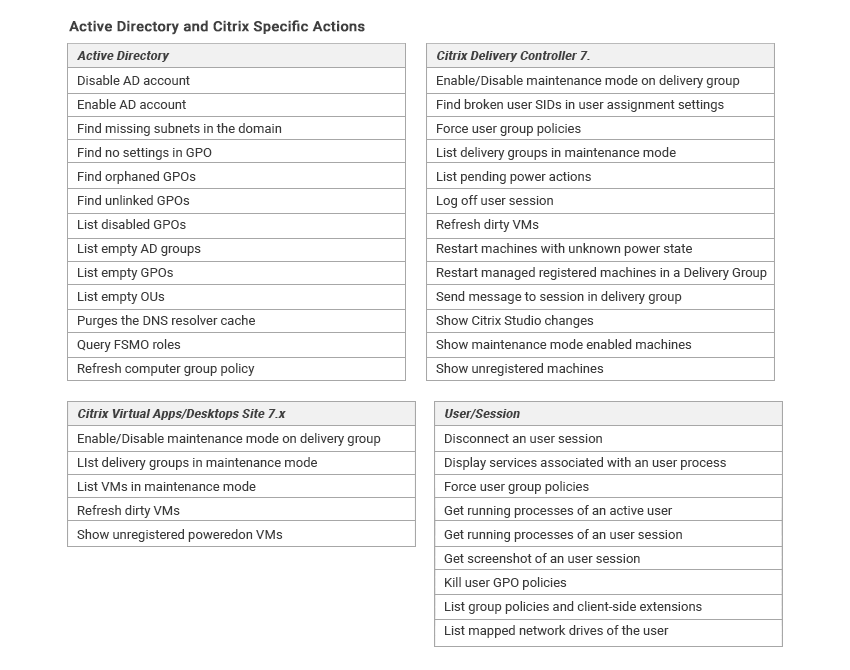
As shown above, there are now many new actions that an IT user who has the action assigned to them can execute. For example, if you wanted to find out when a VDI desktop last rebooted there is an action for that, which can help determine if the desktop is running longer than expected and causing the connected end-user to experience slowness within their Citrix session. Alternatively, if you wanted to check why a particular VDI desktop after being migrated to a new private or public cloud could no longer connect to a backend application server, you can run a connectivity test to the target. Running these actions takes less effort than having to remote connect to the Virtual Delivery Agent in question, especially if you have limited access.

There are a lot of new useful Active Directory specific actions, especially around Group Policy where you can quickly list disabled GPOs, unlinked GPOs, or GPOs that don't actually have anything configured inside them. Likewise, there are specific Citrix actions such as sending messages to sessions running from a particular Delivery Group, getting a list of unregistered machines within your Citrix Site, listing mapped network drives for a user who may be reporting that some are missing, or getting a screenshot of the user session which may be displaying an error message.
All of the actions are intended to make the supporting user's life easier and helping solve issues faster with the least amount of end-user disruption.
Auditing remote control actions
What if you need to know the actions that were performed on a particular managed system, and who executed those actions?
Now you can audit the Remote Control Actions which in the audit report will tell you the action performed, by who, on what date and time, and against which managed system.

Assigning remote control actions to users
With this release, you can now assign specific Remote Control Actions to individual users. Previously, you could simply turn all actions on or off and users could run all supported commands.
In large environments with multiple teams, it is often the case that you will leverage a 'Role Based Access Control' approach when assigning permissions to other IT engineers. The benefits of this is that you are not giving too many permissions to the user, overcomplicating what they see and also reducing the risk of mistake whereby an action may be executed such as a restart of a multi-session Virtual Delivery Agent rather than logging a single affected user off the server.
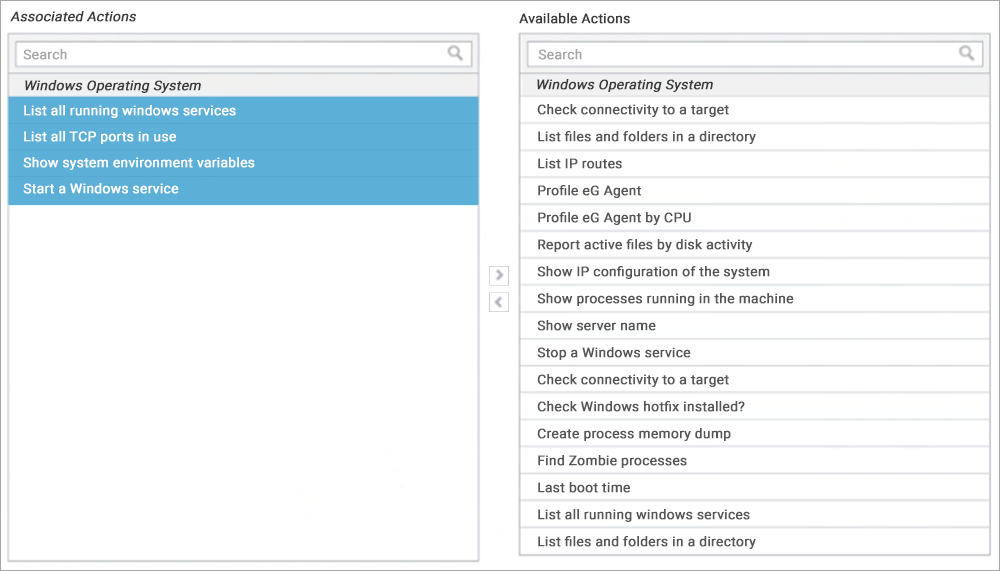
For each user within eG Enterprise, you can assign specific Remote Control Actions within the 'User Preferences' section of the user's account.

By selecting the 'Customize actions' radio button you are given a list of actions under each component type to choose from.

| 12 |
Reporting enhancements
|

eG Enterprise has historically had an array of different reports that a Citrix Administrator can run out of the box to track the health and showcase the performance of a Citrix environment.
Now with version 7.2 several enhancements have been made.
User experience by GEO
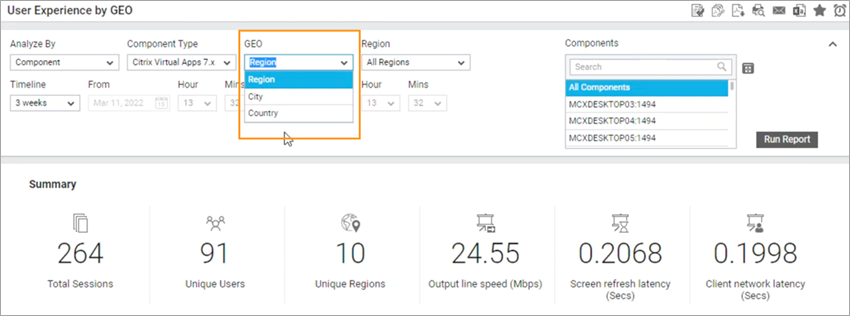
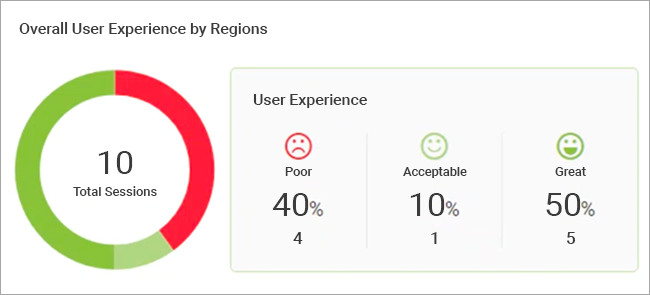
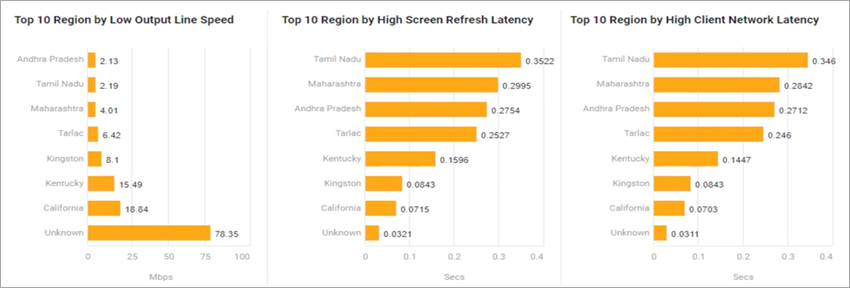
Firstly, there is a 'User Experience by GEO' report, providing you with key performance metrics for user sessions based in a particular Region, City, or Country.

You have the ability to customize the report over a specific period of time and for one or more different components, and the report generates many different charts to give you great insight into how sessions within that location are performing.

Further, the report displays Top 10 bar charts for latency, allowing you to focus your time on users who are experiencing the most impact when it comes to latency, useful in today's world where many people work between the office and home.

User experience by delivery groups
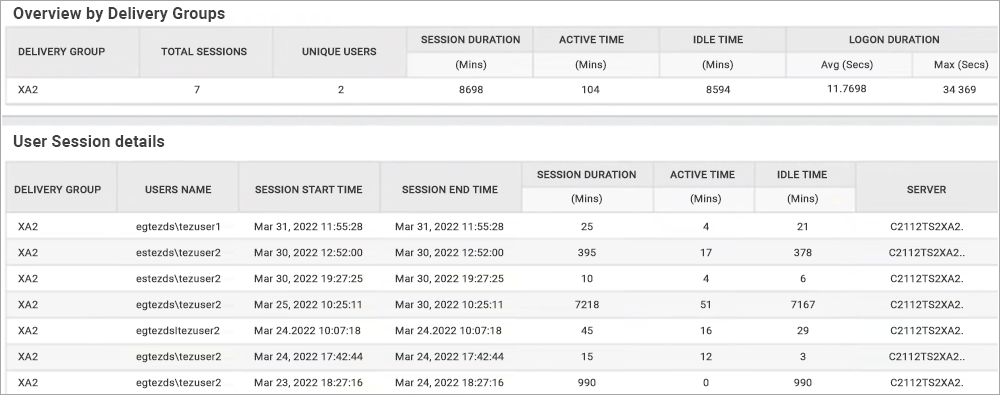
You can run reports against a specific Delivery Group to capture session activity details. Previously you could only do this for the Site. This can be useful if you have Delivery Groups dedicated for departments, and one department complains of issues such as slow logons.
After browsing to the 'Sessions - Sessions by Users' report and selecting a particular Delivery Group to run the report against, you are given information such as the logon duration, idle time, who logged in on what dates and so on.

GPO performance report
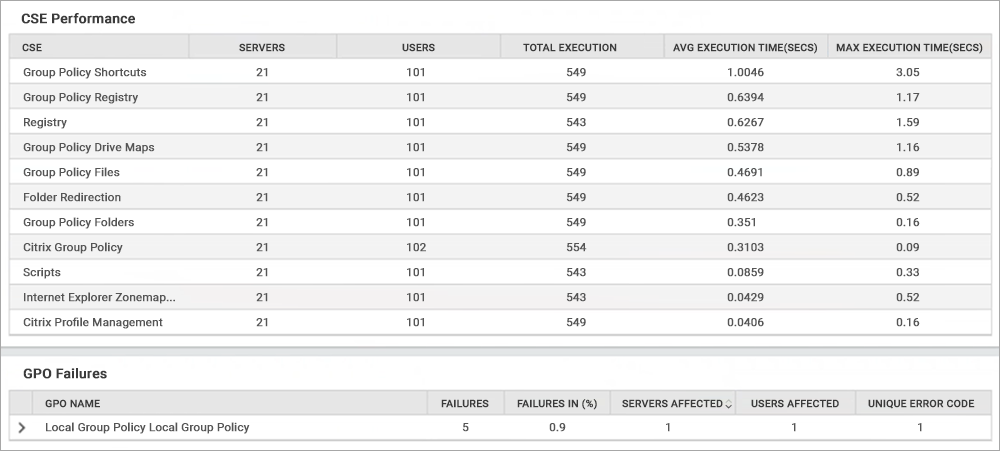
Group Policy over time can become a cause of slow logon performance due to mismanagement of the configuration. Previously eG Enterprise reported on how long Group Policy took overall, but now it can report on the time it takes for each individual Group Policy Object to process and if there are any failures, etc.

As a result of this enhancement, there is no guesswork in which GPO is the culprit for slow logons, allowing you to pinpoint the sudden slowness of logons to a change in the Group Policy configuration for example.
Automation capabilities

Previously with the older versions of eG Enterprise you could run built-in Remote Control Actions such as rebooting a managed endpoint or starting up a Windows service. Now, enhancements in eG Enterprise v7.2 have been made giving you the ability to create your own automations to assist with whatever use case or challenge you are dealing with. For example, if you have some scripts that you typically run as part of your troubleshooting process, you can incorporate them into eG Enterprise and run them automatically. This opens up the opportunity to meet all of your requirements when it comes to automating actions without having to use other tools or methods which can be cumbersome to the IT administrator.
Physical desktop monitoring

eG Enterprise v7.2 also now has the capability to monitor physical desktops as well using the same light-weight agents that are used for monitoring virtual desktops. One key addition is the ability to monitor the home network connectivity including WiFi strength and the Internet connectivity. This is useful functionality that helpdesk staff can use to quickly determine if a user's issue is with their home network.
The physical desktops to be monitored do not have to be domain joined, supporting the common scenario where staff use their own personal devices when working from home. The eG Manager console provides a dedicated section where you assign the light-weight remote agent to physical desktops and before you know it you will have many details about the makeup and performance of the physical desktop and network it is connected to. By getting insight into key metrics such as CPU utilization, GPU performance metrics, WiFi strength, and more, IT administrators are much better equipped to support remote working which has become much more common recently and has historically been challenging. This is an excellent addition to the product.

Summary
The eG Enterprise monitoring solution moves from strength to strength with the latest release of the product which contains many new useful features to effectively monitor your Citrix deployment whether on-premises or in Citrix Cloud.
The product enhances its capabilities of monitoring the core components within a Citrix environment, providing enhancements to reporting to aid with troubleshooting and benchmarking health and performance over time, and empowering your helpdesk and technicians to more quickly and effectively troubleshoot and resolve issues with new Remote Control Actions, reducing the requirement to escalate tickets to higher levels of support which would only take up more resource and increase the time a user's productivity is being impacted.
As you will have realized from reading this article, a lot of development effort has been put into the product, with eG Innovations taking feedback from customers and aligning the products monitoring capabilities with the latest developments around cloud and remote working practices.


