
Adding the Juniper Juniper SRX
The eG Enterprise cannot automatically discover the Juniper SRX. This implies that you need to manually add the component for monitoring. Remember that the eG Enterprise automatically manages the components that are added manually. To add a Juniper SRX, do the following:
- Log into the eG administrative interface.
- Click on the Add Component button in the right corner of the Components at a Glance page that appeared or follow the Infrastructure -> Components -> Add/Modify menu sequence.
-
The Components page will then appear. In the Components page, select Juniper SRX as the Component type and click the Add New Component button.
-
Figure 1 will then appear.
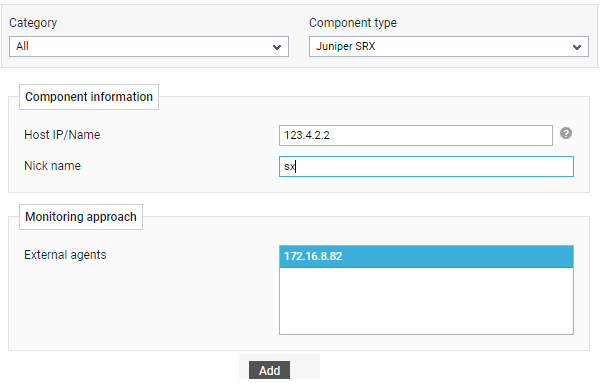
- Specify the Host IP/Name and the Nick name for the Juniper SRX component.
-
Next, select the External agent that will monitor the target Juniper SRX component.
-
Finally, click the Add button to register the changes
-
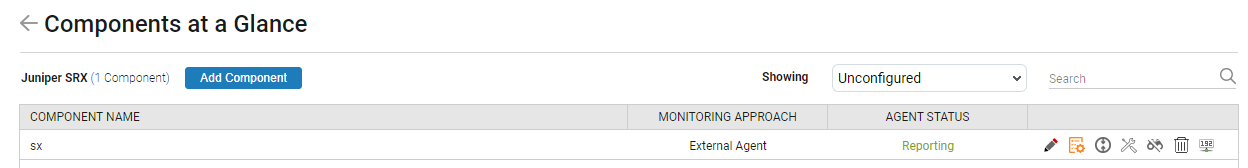
Once the Juniper SRX component is added successfully, you will be again redirected to the Components page (see Figure 2). Using the options provided in the Components page, you can modify, unmanage or delete the newly added component. In addition, you can also configure the tests, set thresholds and maintenance policies, and change the IP address.
-
To collect the performance metrics, you may need to manually configure the tests that are mapped to the Juniper SRX component. To configure the tests that need manual configuration, click on the
 icon in Figure 2. This will lead you to the Specific Test Configuration page where the unconfigured tests for the Juniper SRX component will be listed in the Unconfigured Tests list box.
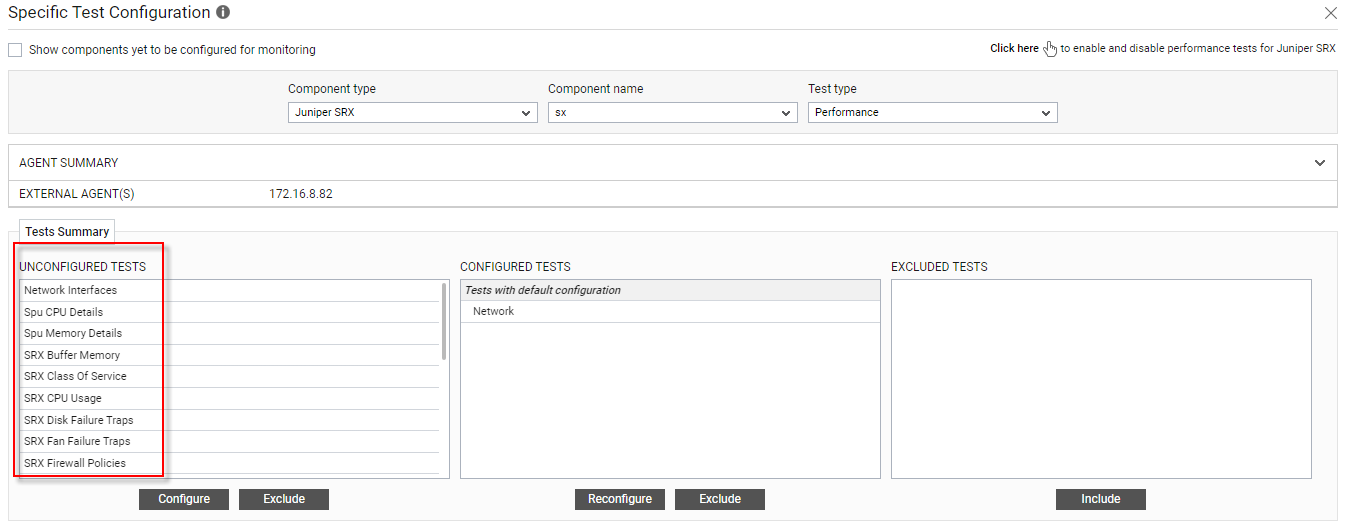
Figure 3 : Unconfigured tests for the Juniper SRX component
-
Now, click on the Spu CPU Details test to configure it. To know how to configure this test, refer to the Monitoring Juniper SRX
-
Next, configure the Device Uptime, Network test and Network Interfaces tests. To know how to configure these tests, refer the Unix and Windows Servers document.
-
Once all the tests are configured, switch to the Monitor tab to view the performance metrics reported by the tests.
