Detailed Diagnostics
By reporting detailed diagnostics on transaction responsiveness and errors, eG Enterprise not only points you to the slow/stalled/error transaction URLs, but also reveals what could be causing the slowness/errors.
Figure 1 reveals detailed diagnosis of the Avg response time measure of the Node.js Business Transactions test.
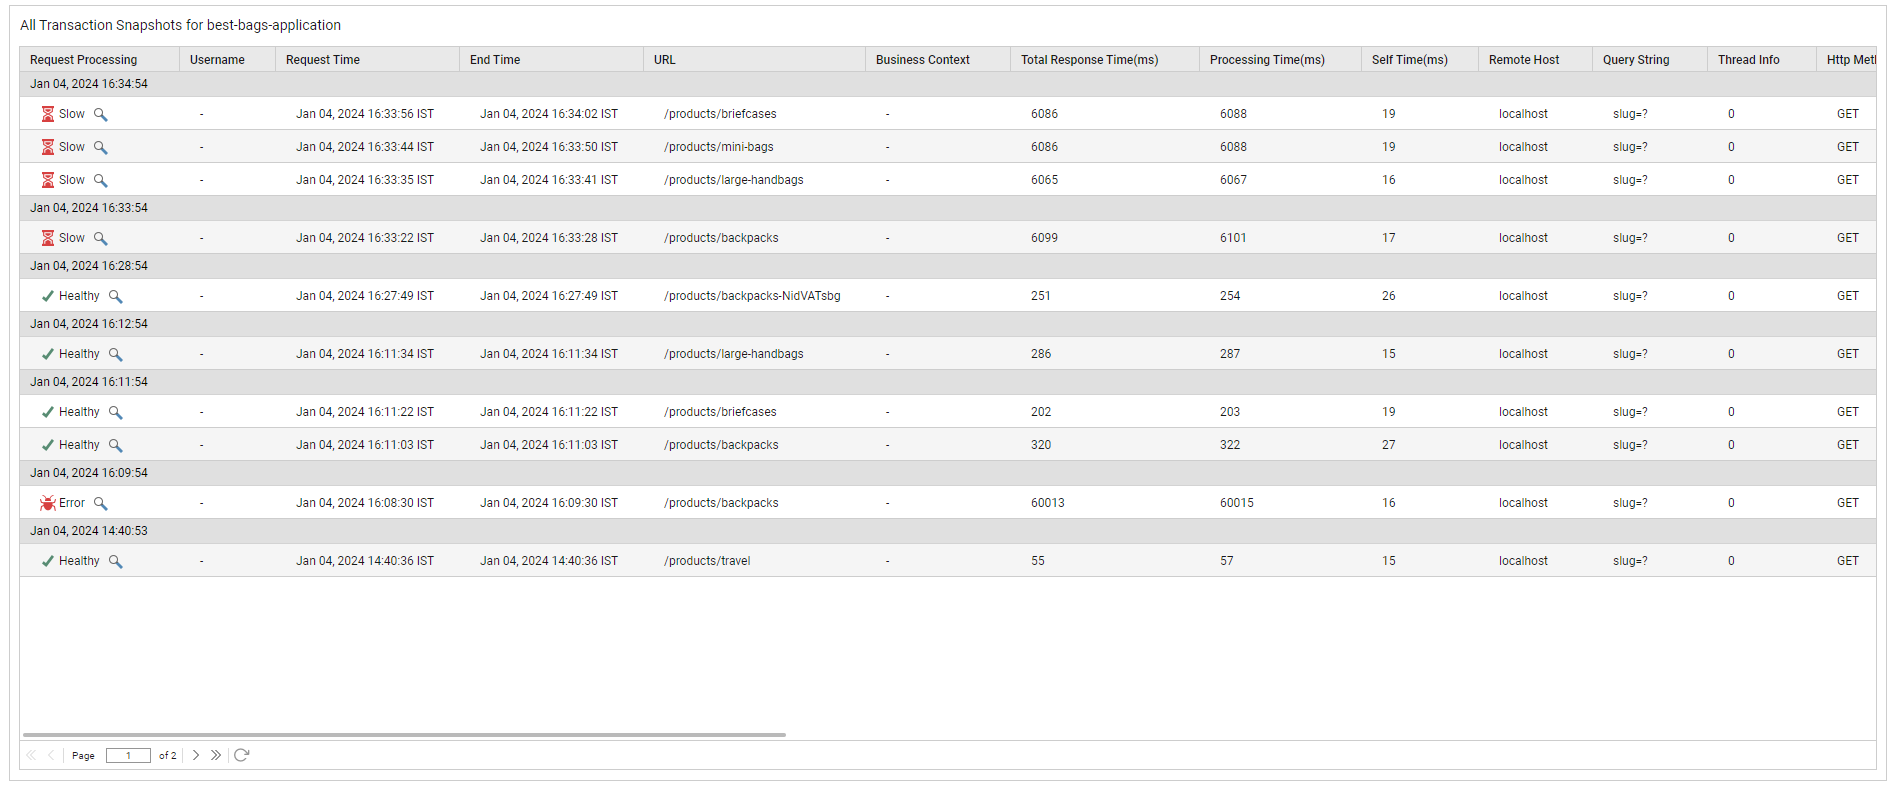
Figure 1 : The detailed diagnosis of the Avg response time measure of the Node.js Business Transactions test
The detailed diagnosis reveals the individual transaction URLs in the grouped URL that users requested for, the total response time of each transaction, the client (remote host) from which each transaction request was received, the thread executing the transaction, and the query string of the transaction URL.
The per-transaction response time displayed in Figure 1 includes the following:
- The total time for which the transaction request was processed by the target Node.js application and by other BTM-enabled Node.js application in the transaction path thereafter, until the time the response for that transaction request was sent out by the target Node.js application;
- The time taken by external calls (Database query (including SQL and NonSQL) / HTTP / RabbitMQ AQMP protocol) to other Node.js applications or backend servers in the transaction path;
Additionally, the overall experience of the users with each transaction – whether it is slow, stalled, or error - is also revealed in the REQUEST PROCESSING TIME column. Furthermore, the HTTP headers, cookies, the HTTP status code returned by the monitored node in response to the transaction request, and the HTTP method invoked by the transaction on that node are also revealed. The per-transaction statistics are also sorted in the descending order of the transaction response time, starting with the slowest transaction and ending with the healthiest one. In the event that the Avg response time of a grouped URL registers an abnormally high value, you can use these detailed metrics to quickly and accurately identify the exact transaction in the group that is significantly contributing to the poor user experience with the group.
Once a slow/stalled transaction is identified, the next question is what is causing the transaction to slowdown. Transaction responsiveness can be impacted by any of the following factors:
- An inefficient database query run by the target Node.js application in the transaction path;
- Issues in the Node.js application code;
- A poorly responsive remote service call made by the target Node.js application or any other Node.js application in the transaction path;
With the help of illustrated examples, the
Detailed Diagnostics Revealing that Slow Node.js Processing is the Reason for Transaction Slowness
