How does eG Enterprise Monitor PostgreSQL Server?
eG Enterprise employs agent-based or agentless techniques to monitor the PostgreSQL server. An eG agent periodically checks the status of critical database operations and proactively report problems.
Pre-requisites for Monitoring On-premises PostgreSQL Server
-
In order to monitor an on-premises PostgreSQL server, you need to manually create a special database user account in every PostgreSQL database instance that requires monitoring. The sample script we recommend for user (for example egtest user) creation for eG monitoring is:
CREATE ROLE egtest LOGIN
ENCRYPTED PASSWORD {‘egtest password’}
Specify the name of this user in the Username text box while configuring the tests.
-
For the eG agent to connect to the target PostgreSQL server and collect the required metrics, administrators should specify the details of the eG agent in the pg_hba.conf file of the PostgreSQL server. The steps to be followed as discussed below:
-
Execute the show hba_file command from the command prompt or from the shell script of the PostgreSQL command. Note that the command should be executed by a user who is vested with superuser privileges, for example, pgadmin user.
-
Once the command is executed successfully, the location of the pg_hba.conf file will be displayed as shown in Figure 1.
-
Open the pg_hba.conf file using any editor of your choice.
-
Append the details of the eG agent in the following section:
# TYPE DATABASE USER ADDRESS METHOD
For example, you can specify the details of the eG agent with IP address 172.16.14.106 as:
host all all 172.16.14.106/32 scram-sha-256
Figure 2 : Appending the IP address of the eG agent in pg_hba.conf file
-
-
For the PostgreSQL Workload test to run and collect metrics on the query execution statistics of the target server, the user for that test should enable the pg_stat_statements and then restart the PostgreSQL server. To enable pg_stat_statements, do the following:
-
As the first step, run the following command from the command prompt of the target PostgreSQL server:
CREATE EXTENSION IF NOT EXISTS pg_stat_statements WITH SCHEMA public;
-
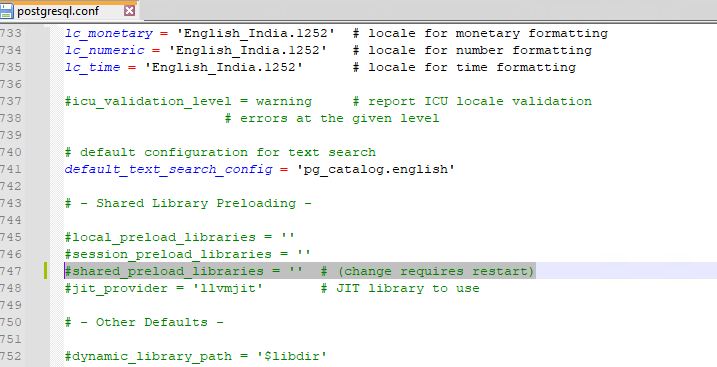
Next, open the postgresql.conf file (in any editor of your choice) available in <PostgreSQL_INSTALL_DIR>\PostgreSQL\<Version of PostgreSQL server installed>\Data folder, in case of Windows installation or /etc/postgresql/<version of PostgreSQL server installed>/main folder in case of Linux installation. Now, locate #shared_preload_libraries option in the postgresql.conf file (seeFigure 3).

Figure 3 : Editing the postgresql.conf file
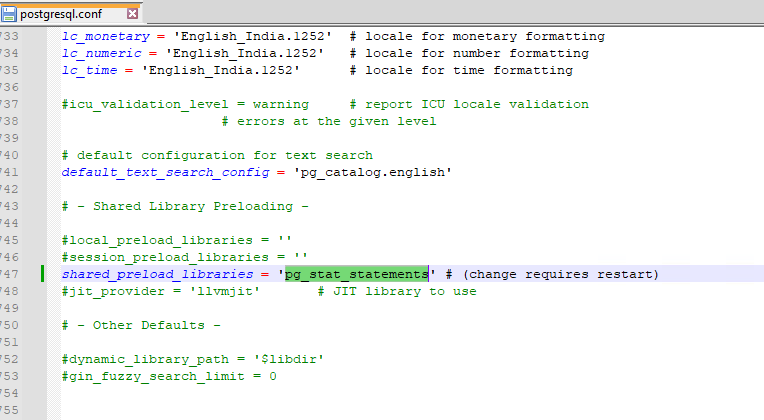
Then, uncomment the shared_preload_libraries option and specify the command as follows:
shared_preload_libraries = 'pg_stat_statements'

Figure 4 : Viewing the edited postgresql.conf file
Finally, save the postgresql.conf file.
-
Next, grant the following privilege:
GRANT pg_read_all_stats TO <User_name>;
In our example, your specification should be:
GRANT pg_read_all_stats TO egtest;
-
-
For the PostgreSQL Deadlocks test to run and collect metrics , you should grant the following privilege:
GRANT pg_read_all_settings TO <username>;
In our example, your specification should be:
GRANT pg_read_all_settings TO egtest;
Pre-requisites for Monitoring PostgreSQL Server hosted on Cloud
-
In order to monitor a PosgreSQL server hosted on Microsoft Azure/AWS infrastructure, you need to manually create a special database user account in every PostgreSQL database instance that requires monitoring. When doing so, ensure that this user is granted CONNECT privileges. The sample script we recommend for user (for example egtest) creation for eG monitoring is:
CREATE ROLE egtest LOGIN
ENCRYPTED PASSWORD {‘egtest password’}
GRANT CONNECT ON DATABASE "<DB_NAME>" TO <USER_NAME>;
Specify the name of this user in the Username text box while configuring the tests.
-
For the PostgreSQL Workload test to run and collect metrics on the query execution statistics of the target server hosted on the Microsoft Azure infrastructure, the user should enable the pg_stat_statements and then restart the PostgreSQL server, To enable pg_stat_statements, do the following:
-
Go to the Microsoft Azure portal.
-
Navigate to the Azure Database for PostgreSQL server.
-
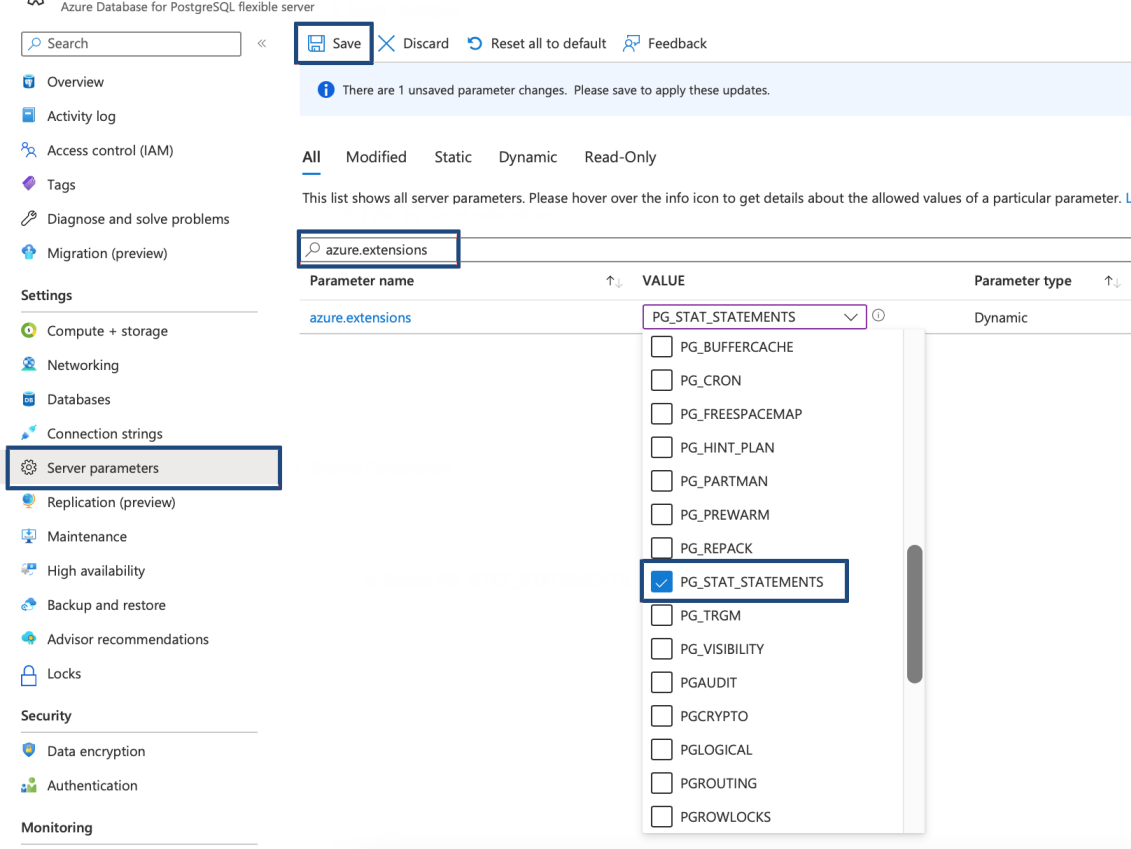
Then, click on the Server parameters option under the Settings node and find the azure.extensions parameter.
-
Next, add the pg_stat_statements extension as a value to the azure.extensions parameter as shown below.

Figure 5 : Adding pg_stat_statements extension
-
Save the changes and restart the database instance to apply the new settings. Doing so will ensure that the pg_stat_statements extension collects and displays statistics on the execution of SQL statements.
-
Optionally, you can set other configuration parameters related to like pg_stat_statements such as pg_stat_statements.track and pg_stat_statements.max. If you wish to control which SQL statements should be tracked by the pg_stat_statements extension, you can search for pg_stat_statements.track parameter in the Server Parameters page and configure a value as required. By default, this parameter is set to 'Top' indicating that the extension will track only top-level SQL statements executed directly by a user. If you want this extension to track all SQL statements including those executed inside functions or as part of another statement, then set 'All' for this parameter. Likewise, you can also control the number of statements that can be tracked by the pg_stat_statements extension by setting the value for the pg_stat_statements.max parameter in the Server Parameters page. By default, this parameter is set to 5000.
-
To create the pg_stat_statements extension in the target database if it does not already exist, ensure that the pg_stat_statements extension is installed correctly and grant permissions to a user (here, for egtest user) to read the statistics, run the following commands:
CREATE EXTENSION IF NOT EXISTS pg_stat_statements WITH SCHEMA public;
GRANT pg_read_all_stats TO <egtest>;
-
-
For the PostgreSQL Workload test to run and collect metrics on the query execution statistics of the target server hosted on the AWS infrastructure, the user should enable the pg_stat_statements and then restart the PostgreSQL server, To enable pg_stat_statements, do the following:
-
Go to the Amazon RDS Console.
-
In the navigation pane, click the Parameter groups. If you do not have a custom parameter group, click on Create parameter group and create a new parameter group and associate it with the target PostgreSQL instance. Otherwise, select the parameter group associated with the target PostgreSQL instance and click on Edit parameters.
-
In the parameter group, choose for the shared_preload_libraries parameter and find and add the pg_stat_statements extension to it.
-
Optionally, you can set other configuration parameters related to pg_stat_statements such as pg_stat_statements.track and pg_stat_statements.max. If you wish to control which SQL statements should be tracked by the pg_stat_statements extension, you can search for pg_stat_statements.track parameter in the Parameters groups page and configure a value as required. By default, this parameter is set to top indicating that the extension will track only top-level SQL statements executed directly by a user. If you want this extension to track all SQL statements including those executed inside functions or as part of another statement, then set all for this parameter. Likewise, you can also control the number of statements that can be tracked by the pg_stat_statements extension by setting the value for the pg_stat_statements.max parameter in the Parameters groups page. By default, this parameter is set to 5000.
-
Once you added the pg_stat_statements extension to the parameter group, reboot the PostgreSQL instance for the changes to take effect.
-
To create the pg_stat_statements extension in the target database if it does not already exist, ensure that the pg_stat_statements extension is installed correctly and grant permissions to a user (here, for egtest user) to read the statistics, run the following commands:
CREATE EXTENSION IF NOT EXISTS pg_stat_statements WITH SCHEMA public;
GRANT pg_read_all_stats TO <egtest>;
-
How to limit the number of connections for a user?
Unlimited concurrent connections to PostgreSQL could allow a successful Denial of Service (DoS) attack by exhausting connection resources; and a system can also fail or be degraded by an overload of legitimate users. Hence, it is recommended to limit the number of connections a user can create in PostgreSQL database server, you need to login to the database as admin user and then alter the role. The steps to be followed as discussed below:
-
Login to the database as postgres user with admin privileges.
For instance, create a user with Username:egtest and Password:egtest with admin privileges.
-
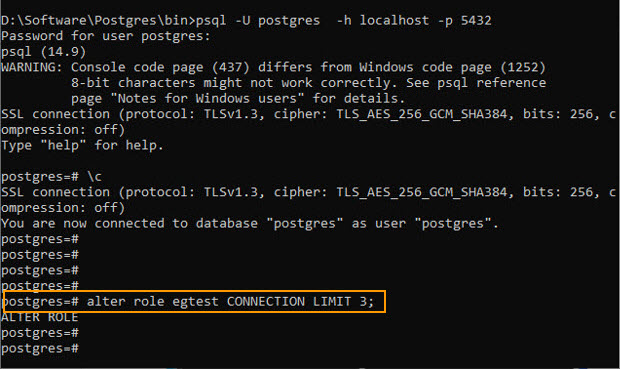
Then, alter the connection limit for egtest user with n number of connections. Let's say for example, if you specify 3 against connection limit as shown in Figure 6, then it indicates that the egtest user cannot establish more than 3 connections to the database.

-
If the number of connections to the database exceeds the connection limit, new connections fail and return an error. That means, If you try to establish more number of connections for the egtest user than the limited count 3, the error message (see Figure 7) will be shown.

Managing the PostgreSQL Server
eG Enterprise cannot automatically discover the PostgreSQL server. This implies that you need to manually add the component for monitoring. Remember that the eG Enterprise automatically manages the components that are added manually. To manage a PostgreSQL Server component, do the following:
- Log into the eG administrative interface.
-
eG Enterprise cannot automatically discover the PostgreSQL component. You need to manually add the server using the COMPONENTS page (see Figure 8) that appears when the Infrastructure -> Components -> Add/Modify menu sequence is followed. Remember that components manually added are managed automatically.

- Specify the Host IP and the Nick name of the target PostgreSQL server in Figure 8. The Port number will be set as 5432 by default. If the server is listening on a different port, then override this settings.
- Then, click the Add button to register the changes.
-
When you attempt to sign out, a list of unconfigured tests appears (see Figure 9).

Figure 9 : List of tests to be configured for the PostgreSQL
- Click on the PostgreSQL Access test to configure it. To know how to configure the test, click here.
- Once all the tests are configured, signout of the eG administrative interface.


