Jetty monitoring for enhanced application performance

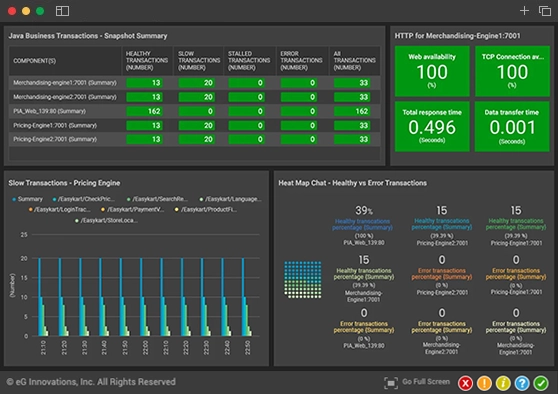
Monitor your Jetty application stack within a single-pane-of-glass and get visibility into the performance of your JVM, Servlet containers, application code, database connections, slow queries, external service calls, and more.

Free Trial

Trusted by leading companies

Why is Jetty monitoring important?

Jetty is a popular open-source web server and servlet container written in Java. It is developed by the Eclipse Foundation and is used to host and run Java-based web applications. Jetty is known for its lightweight, low memory footprint and embeddable nature, whereby developers can embed Jetty directly into their Java applications. It is widely used in both development and production environments.

To ensure high application performance, it is essential to monitor the Jetty application server, the Java Virtual Machine (JVM) it uses, the application components it hosts, and the infrastructure tiers supporting it. IT teams and developers need the capability to proactively detect performance problems before they impact end-users of the Java application.

Answer key questions on Jetty application delivery instantly

Jetty administrators can continuously track key health indicators such as:

  • the availability of the Jetty server
  • responsiveness of the servlet container
  • resource usage at the JVM, application server and host-level - CPU usage, memory usage, and thread utilization
  • how well the application server processes requests
  • how quickly the server completes transactions and response times
  • overall server security and more

Gain AIOps-driven insights with Jetty web server metrics

AIOps-driven auto-discovery and auto-baselining technologies provide  rapid insights into Jetty application and server performance and availability.

Out-of-the-box intelligent metric thresholds, alerts, root-cause diagnostics and anomaly detection ensure administrators can proactively monitor and troubleshoot Jetty deployments before applications and end-users experience problems.

Key metrics monitored and alerted on include:
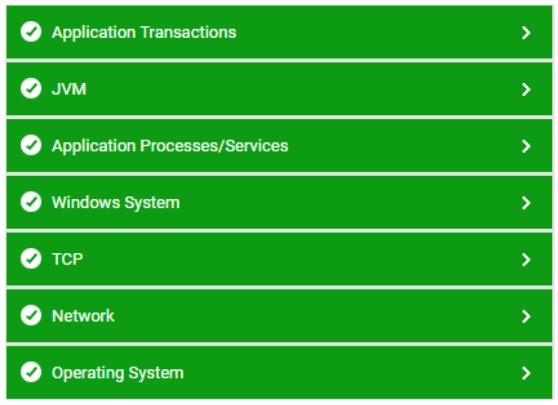

End-to-end transaction monitoring of Jetty service requests

  • Get rich visualizations and granular monitoring of all your Java Business Transactions. See a transaction flow graph that shows all the tiers processing a transaction; see response times at each tier. Identify if slowness is due to Java processing, SQL queries, external calls, web service API calls, etc.
  • Understand the actual execution of every individual service and service-request.
  • Leverage topology maps to understand the dependencies within your specific environment
  • Understand user experience and proactively detect any slowness with a combination of real user (RUM) and synthetic monitoring

Get code-level visibility for application performance optimization

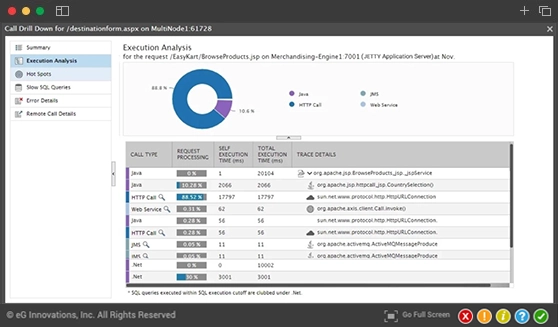
eG Enterprise allows developers to easily identify Java code-level issues.

  • Automatically get alerted to slow Java application transactions
  • Analyze the transaction flow using distributed transaction tracing and determine where slowness is occurring (app server, database, remote calls)
  • Hot spot analysis!
  • Easily drill down to get Java code-level visibility


Start your free trial or schedule a custom demo with an engineer

  • Works on cloud environments, hybrid cloud setups and on-premises deployments
  • Deploy eG Enterprise using our SaaS platform or on-premises
  • Suitable for monitoring cloud applications, digital workspaces and IT infrastructures
Please Enter Valid Work Email
eG Enterprise