MongoDB Monitoring
and Performance Management

Free Trial

Trusted by leading companies

24x7 Monitoring of MongoDB is Important

MongoDB is a cross-platform, document-oriented NoSQL database, which is used for high-volume data storage. NoSQL databases are scalable and have superior performance when compared to relational databases. Also, compared to the relational model, the versatility and ease of use of NoSQL data models can speed up. Because of its flexibility and performance, MongoDB is currently the most widely adopted document-oriented database for modern applications.

eG and PD logo

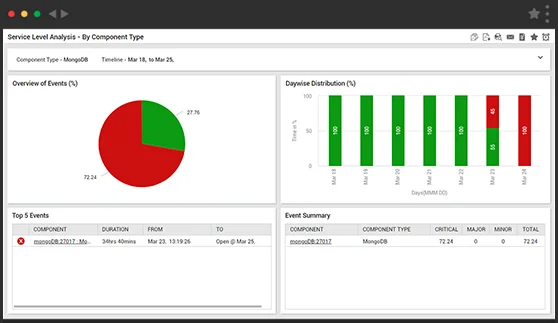
If MongoDB is not available or is slow to respond, application performance can suffer. Hence, it is critical to proactively monitor and manage the performance of MongoDB servers. eG Enterprise provides in-depth insights into MongoDB availability and performance. eG agents can track database utilization, errors, throughput, resource saturation, and other key performance indicators (KPIs) of MongoDB server instances.

eG Enterprise has been incredibly useful and has far exceeded our expectations. Metrics relating to SQL and missing indexes have provided critical information that we had long suspected were performance issues. Now we have the information to address specific performance
challenges.

Pejman Farahi Applications Specialist, Aird Berlis

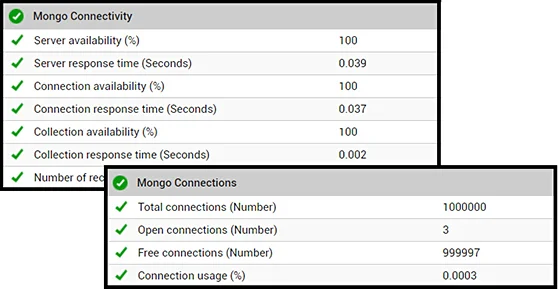
Track MongoDB Availability and Connection Usage

  • Monitor whether users are able to connect to the MongoDB instance and execute queries.
  • Detect any increase in connection time or query execution time.
  • Track connection traffic to each MongoDB instance. Get proactive alerts to any unusual traffic activity via auto-baselining.
  • Detect potential connection leaks to the MongoDB instance and identify the affected applications.
  • Track connection usage vs. capacity and determine times when the database instance is overloaded.
Track MongoDB Availability and Connection

Monitor MongoDB Memory Usage and Identify Bottlenecks
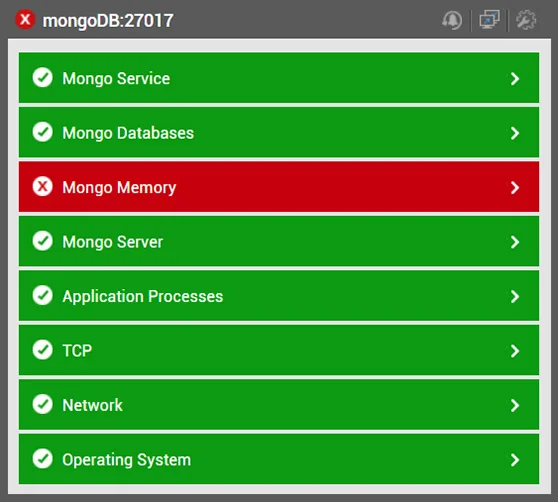
  • Evaluate the memory allocated to an instance and the memory currently in use to identify whether there are times when the memory allocated to a MongoDB instance is insufficient.
  • MongoDB uses both the storage engine's cache and the filesystem cache. Monitor the cache usage, dirty cache used, and the number of pages evicted from the cache to identify whether there are any bottlenecks.
  • Get alerts when dirty data cache size grows, which could highlight that data is not being written to the disk fast enough. This, in turn, could lead to newer pages being read directly from the disk, which could be detrimental to performance.
  • Cursors are used to access data sets. Detect situations when the number of open cursors is increasing. This could indicate that some queries are running for a long time, possibly because they are not using the right indexes.
  • Track timed-out cursors, which are indicative of applications that have failed, to close cursors after use.
Monitor MongoDB Memory Usage and Identify Bottlenecks

Monitor Heterogeneous Database Servers
from One Console


Identify and Solve MongoDB Performance Issues Quickly

  • The WiredTiger engine of MongoDB uses a ticketing system to control the number of threads in use as threads can starve each other of CPU. Tickets are an internal representation for thread management. Monitor times when read and write ticket usage is high, and are thereby, indicative of CPU bottlenecks.
  • Track the number of requests in the Lock queue. Identify whether there is any lock contention or inefficient application logic that could be affecting application performance.
  • Baseline the average duration for which read locks were held by collections on a MongoDB instance. Identify collections that are locked in for a longer time, fine tune, and fix application problems that could be inducing these lock ins.
  • Monitor the average waiting time to acquire a lock in a MongoDB instance. If the wait time is high, this indicates a possible concurrency issue resulting in long-running queries that in turn will affect application performance.

Assure MongoDB Performance by
Monitoring KPIs

  • Monitor the data size of all collections, index size, and storage size to identify abnormal data growth and plan disk space requirements in advance.
  • Monitor the collections in a database that are large. Get detailed information on large collections and optimize collection sizes or consider sharding the collections.
  • Track database throughput over time, including read and write rates.
  • Monitor queued read and write requests and compare with throughput to determine whether the database server can cope up with the incoming workload.
Assure MongoDB Performance by Monitoring KPIs
  • Too many lock requests can affect MongoDB performance. Classify the type of locks in queue.
  • Monitor the MongoDB logs and identify asserts, which represent fatal, error conditions or warnings. Alert administrators so that they can quickly take action to resolve the issues.

Detect and Solve MongoDB Replica Set Issues

  • Determine whether database replication is working properly on each node and whether each member node of a replica set is running.
  • Get alerts on data sync issues between primary and secondary nodes during replication.
  • Assess the replication lag - i.e., how far a secondary node is behind the primary node and get alerts if the lag is too high.
  • Monitor the oplog window, which is the interval of time between the oldest and the latest entries in the oplog (MongoDB's operations log).
  • Determine when the primary node in the replica set has failed over to the secondary node.

Monitor MongoDB Performance from an Application Perspective

eG Enterprise application performance monitoring allows MongoDB performance to be monitored in the context of the applications using the database server.

  • Without requiring any agents for the MongoDB instances, eG Enterprise APM traces all application accesses and reports on slow queries and exceptions during database processing.
  • When a specific web page or URL is slow, you don't have to wonder any more as to what is causing the slowdown. eG Enterprise APM gives you the answers at your fingertips.

This eliminates finger-pointing between application development, application operations, and database admin teams.


How eG Enterprise for MongoDB
Monitoring helps Database Administrators

  • Database administrators can instantly identify the tiers that are causing the performance issues and help the IT teams accordingly.
  • Administrators get detailed visibility into critical aspects of MongoDB database performance - assertions, locks, replication, queries, compression, journaling, bandwidth, transaction rollbacks, checkpoints, etc., to solve performance issues faster.
  • Get personalized reports to view metrics on database performance, user experience, underlying infrastructure, etc.
  • Through the proactive and intelligent alerting system, admins can ensure business continuity and enhance the user experience for their organizations.


Start your free trial or schedule a custom demo with an engineer

  • Works on cloud environments, hybrid cloud setups and on-premises deployments
  • Deploy eG Enterprise using our SaaS platform or on-premises
  • Suitable for monitoring cloud applications, digital workspaces and IT infrastructures
Please Enter Valid Work Email
eG Enterprise