Solaris Monitoring
Monitor Solaris OS, Zones, LDOMs from one console. Track OS and container performance and correlate with application performance to identify and resolve issues quickly.
Free TrialSolaris Monitoring for Business Service Delivery
Continuous monitoring of your key applications is imperative to eliminate prolonged delays in the delivery of the business-critical services and to minimize service downtimes. However, not all issues in service performance can be attributed strictly to the applications.
Most often, errors at the operating system-level can ripple and affect the performance of applications executing on them; this in turn, can cause the service quality to deteriorate. Focusing on application performance metrics alone will not necessarily lead to the source of the problem, and for complete confidence the underlying operating system must also be monitored 24 x 7.
The eG Enterprise suite includes 100% web-based Solaris performance monitoring solution for Solaris servers. Besides measuring the overall operating system health, these models also periodically check: the availability of the host and any critical processes and services, resource contention, I/O activity, network traffic, and network latency. Performance monitoring of the Solaris hardware is also included in eG Enterprise.
eG Innovations delivers a robust, reliable and extremely valuable solution to deliver maximum uptime and user satisfaction. Pre-emptive alerting helps us to address performance issues immediately before they affect system and application availability.![]()
eG Enterprise
Solaris Server Performance Monitoring
The Solaris operating system is known for its scalability and is commonplace in many large server farms. As a result, many business-critical services are configured to use applications executing on Solaris-based servers. The continuous availability of these end-user services depends upon the error-free functioning of the Solaris servers and the applications deployed on them.
For round-the-clock Solaris monitoring and to proactively alert administrators to potential performance bottlenecks, eG Enterprise provides a dedicated Solaris performance monitoring model for servers.
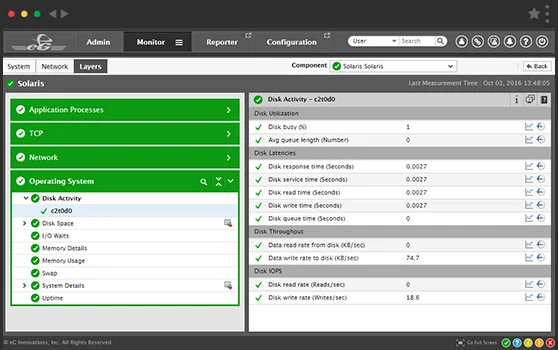
Inspired by the traditional OSI model, this representation of Solaris servers is composed of a set of hierarchical layers derived from the Solaris architecture. These layers are arranged hierarchically with upper layers depending on the performance of lower layers. Each layer in turn is mapped to a variety of tests, which report a critical metrics related to the Solaris server.
You can have this easy-to-use model up and running in no time, as it only requires that a single eG agent be installed on each Solaris server that has to be monitored. An agentless monitoring option is also available, where a single agent on a Windows system can be configured to monitor any number of remote Solaris servers via SSH/Rexec.
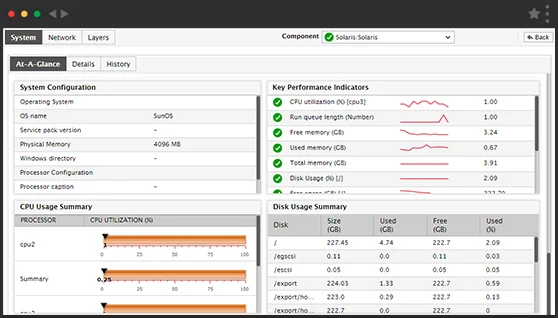
The agent uses secure mechanisms to extract critical statistics from the target Solaris systems. A wide variety of metrics related to resource usage, network health, TCP retransmissions, and availability of critical Solaris processes is reported, plus extensive hardware metrics.
The values of each metric are compared against pre-defined thresholds set by the administrator, or against automatically computed norms determined by eG Enterprise based on past performance. Any deviations are alerted proactively to administrators, thus enabling administrators to initiate corrective actions quickly. In addition, the eG Enterprise intelligent correlation engine automatically performs correlation of the metrics extracted by each of the layers, and accurately isolates the problem source.


