Infrastructure Reporting Capabilities
Monitoring is not just for troubleshooting problems. eG Enterprise uses empirical data collected from each tier of the infrastructure for trending, analysis and forecasting.
Free TrialeG Reporter:
Web-based Performance Reporting for Applications, Desktops, Users and more
eG Reporter is a web-based enterprise infrastructure reporting software designed for IT administrators and managers. It enables audit and analysis of the performance of all IT components effectively. Using eG Reporter, users view reports that provide insights into the performance of the critical network, server, and application tiers of their infrastructure. Trending, capacity planning, problem troubleshooting, post-factor diagnosis, and service level (SLA) reporting and auditing are some of the key uses of the eG Reporter.
Using the insights provided by eG Reporter, users can:
- Determine how efficiently the network, servers, and applications are working
- Identify where the performance bottlenecks are
- Determine how they can load balance their servers to optimize performance
- Plan for when and how capacity planning initiatives need to be launched
Various types of reports available in the eG Reporter provide powerful insights into an IT infrastructure's performance.
With eG Innovations, we are reducing system maintenance and support costs, avoiding incremental IT spending and eliminating system downtime across the hospital. Performance and prediction reports help us optimize IT spending and save $100,000 per year.![]()
Service Level Reports
For management executives, eG Reporter offers comprehensive health reports that summarize the overall state of each of the services provided by the infrastructure. An executive report on an IT service provides a high level overview of the service's status, with details of the top events for the service and the service components with the highest problems. By reviewing a report of a specific application's health, an executive can determine the percentage of the time that the application's operation was trouble-free. By comparing the performance reports of the different application types, executives can quickly determine where the problem-prone areas of their infrastructure are. Comparison of performance across time periods can also provide indications of whether the infrastructure performance is improving over time. Executives can also understand the mean time to repair problems and understand which tiers of the infrastructure are most problematic.
eG Enterprise's SLA reporting feature offers
- Service level reports for executives
- Top N reports for IT operators to identify bottlenecks
- Trend reports for capacity planning
- Snapshot reports for quick problem diagnosis
- Comparison reports for optimization insights
In-Depth Performance Reports on Every Tier
To assist administrators and operations staff, eG Reporter offers many out-of-the-box network, server, and application reports that provide in-depth insights into the different metrics, their variation with time of day, and deviation from their normal baselines. Service level (SLA) violation reports on an hourly, daily, and monthly basis are also available.
Utilizing infrastructure reporting to access insights into network, system, and application performance provides clear indicators of performance bottlenecks and trends that impact business operations. Users have the flexibility to customize the operation reports to suit their individual needs and preferences. The customized report templates can be saved as favorites for easy cross-reference.
Performance Comparison Reports
Performance comparison reports enable operational staff to effectively cross-correlate between the performance and usage of different infrastructure tiers. For instance, a response time report can be used to depict the response times of the network, web server, application, and database to enable correlation and quick diagnosis of bottleneck points. Likewise, a load comparison report can analyze the effectiveness of the load distribution across different servers. Top-N reports for every metric indicate the applications, networks, and servers that have the highest values.
Snapshot Reports
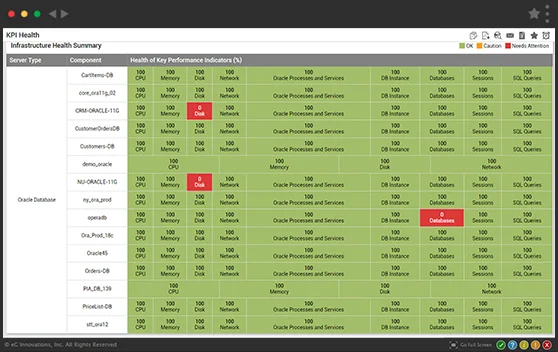
Users can select a time period to analyze and review the performance metrics of specific components comprehensively using a single view, providing clarity and ease. A simple color coding scheme used in this report helps users to quickly pin-point which component(s) could have been problematic during the review period. Context-sensitive analysis of the events and performance data is made available to assist users with detailed drilldowns for further diagnosis.
Key Features of the
eG Reporter
eG Reporter is an ideal solution for in-depth analysis of IT infrastructures. Key features of the eG Reporter include:
- Personalized reports for specific users, depending on their role and responsibility. Users have access to only the services and components in their purview.
- One-click printing of any of the reports.
- Ability to save report templates as favorites for quick access later.
- Ability to save reports as PDF documents.
- Automatic emails of scheduled reports for daily or monthly activity.
- Ability to export data in CSV format and import this in any other data analysis/planning solution.
eG Reporter can be used during all three phases of the IT life cycle. During pre-production and staging, eG Reporter can be effectively used, to study the performance of the different infrastructure tiers during different stress test scenarios. In production environments, the historical reports enable administrators to quickly identify problem areas. Historical trending, consolidated analysis and capacity reports available in eG Reporter are ideal for planning and scaling out IT infrastructures.
Benefits of the Reporting and Analytics Module
- Provides a consistent view of infrastructure performance to management executives and operations staff
- Provides actionable reports to IT administrators, to enable rapid real-time and post-mortem analysis
- Enables executives to get a bird's eye view of the infrastructure performance
- Enables rapid triage of problems by cross correlating performance metrics across diverse IT infrastructure tiers
- Facilitates proactive capacity planning by providing early indicators of abnormal usage levels and trends
Ensures that service levels can be baselined across the network, system, and application tiers, and audit reports provided to document the service levels


