Enterprise Manager Monitoring Tools
Monitor and Diagnose Network, Server, and Application Performance from a Single Console
Free TrialeG Enterprise Management Console
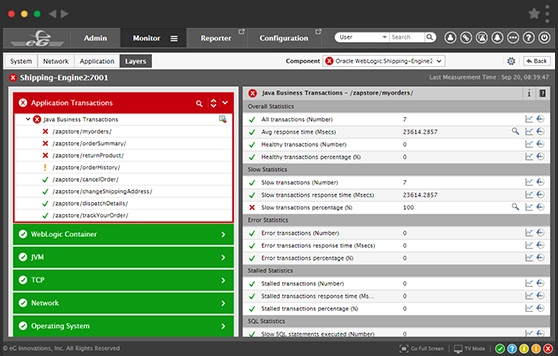
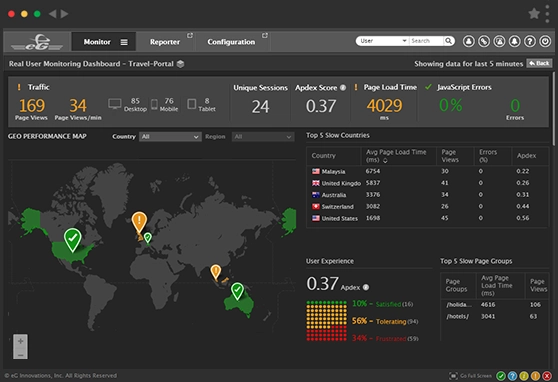
The eG Enterprise Manager is a central web portal that provides administrators with authenticated access over the web to the performance statistics stored in the repository. Personalized views can be created for operators based on their roles and responsibilities, so operators can view and analyze the performance of the infrastructure components that they are responsible for, and can receive proactive alerts pertaining to these components. For large enterprises spanning multiple locations, this capability can be used to provide different views for operators in different geographies. In managed service provider environments, multiple customer infrastructures can be monitored using a central manager (thereby amortizing the software and hardware costs across customers), and different personalized views can be provided for the different customers.
With eG Enterprise, we can now quickly identify root causes of incidents, resolving them before users are impacted. Automatic prioritization and categorization of alerts helps us better focus on the important issues and prioritize our resources accordingly.![]()
Centralized Management of eG Agents and Complete Data Access
The eG Enterprise Manager uses pre-defined models of different infrastructure components (network devices, databases, applications, etc.) to instruct the agents on what metrics need to be collected, and how often. The eG agents report statistics to the manager using web protocols - HTTP/HTTPS; consequently, it is possible to get the eG Enterprise system working without the need to configure elaborate firewall rules. Since all the agent configurations and licensing are handled centrally, very little configuration needs to be performed when deploying the agents. Hence, provisioning for an IT infrastructure can be completed in days, not months.
Flexible Views
Personalized views can be created for operators based on their roles and responsibilities, so operators can view and analyze the performance of the infrastructure components that they are responsible for, and can receive proactive alerts pertaining to these components. For large enterprises spanning multiple locations, this capability can be used to provide different views for operators in different geographies. In managed service provider environments, multiple customer infrastructures can be monitored using a central manager (thereby amortizing the software and hardware costs across customers), and different personalized views can be provided for the different customers.
Performance Dashboard Providing a Comprehensive End-to-End View
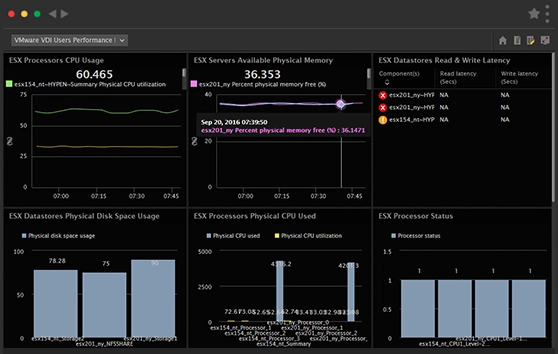
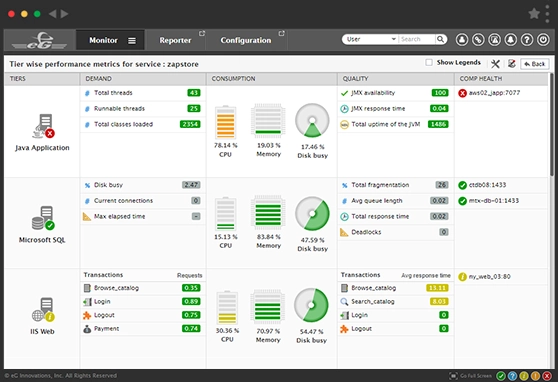
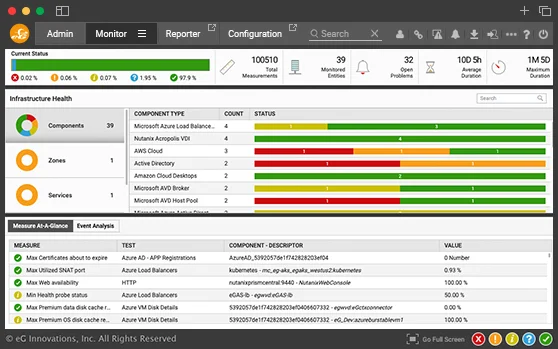
A comprehensive dashboard that provides quick insights into the current status of an infrastructure, and includes context-based drilldowns for detailed analysis.
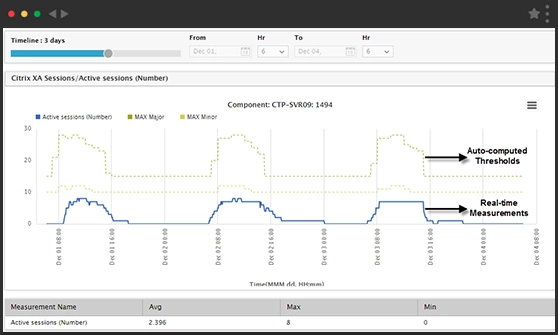
By performing historical analysis of the performance data, the eG Enterprise Manager is able to set automatic thresholds for each of the collected metrics. This ensures quick setup of the eG system as administrators do not have to configure thresholds for each and every metric. At the same time, administrators are alerted to problems as soon as historical baselines are violated - i.e., whenever resource usage exceeds the normal bounds.
Automatic thresholds are a key for proactive alerting, since administrators are alerted to problems that are not straightforward to detect.
Proactive Alerts for Early Detection
Receive personalized, proactive alerts over email, SMS, web, or SNMP, whenever any unusual performance characteristics are observed. Get actionable information and resolve problems early, before users notice and complain.
Using eG Enterprise's patented virtualization-aware automatic triage technology, clearly demarcate the tiers, layers, and domains that are the cause of problems; Differentiate between the cause and effects, so operators can focus on the cause and not be distracted by the effects of problems.
Site-Specific Knowledge Management Capability
Create a site-specific knowledge base wherein operators can keep track of past problems and their resolutions; Using context-sensitive searches on the knowledge base, operators can quickly figure out potential problem resolutions, using the past experience of their peers.
Service Level Reports and Trends
Receive reports of service levels for each metric being collected, and analyze min/max hourly/daily/monthly trends to facilitate capacity planning.


