MySQL Monitoring and Performance Management

Comprehensive Performance Monitoring of MySQL Database Servers

Free Trial

Trusted by leading companies

Achieve SLAs by Proactively Fixing Performance Issues Through 24x7 Monitoring

Over the years, MySQL has been the most popular database platform in use in enterprise IT. Applications across domains and across technologies use MySQL as the backend database for its reliability, ease of use, affordability, and compatibility. To ensure peak performance of these applications, it is essential that the MySQL databases in use are working well.

eG Enterprise embeds best practices to provide proactive monitoring, rapid diagnosis, and empirical reporting for MySQL database servers. IT operations, DevOps, and even development teams can use these insights to determine whether the database server is a performance bottleneck and how to tune it to ensure peak performance.

MySQL Logo

eG Enterprise has been incredibly useful and has far exceeded our expectations. Metrics relating to SQL and missing indexes have provided critical information that we had long suspected were performance issues. Now we have the information to address specific performance
challenges.

Pejman Farahi Applications Specialist, Aird Berlis

Identify and Troubleshoot Slow MySQL
Performance with
Detailed Analytics

  • Continuously monitor the availability and responsiveness of MySQL instances
  • Track connection traffic to each MySQL instance and identify whether there are any denial-of-service attacks happening
  • Identify whether specific users or applications are causing connection leaks on the MySQL server, leading to slowness for other users and applications
  • Identify long running queries; provide query execution plans to identify whether longer execution time is due to table scans or bad design of the queries
  • Monitor all user processes and their active/inactive states, so that if and when slowness is detected, this can be correlated back to a specific user's activity
  • By looking at percentage rollbacks, it helps to detect inefficient application design
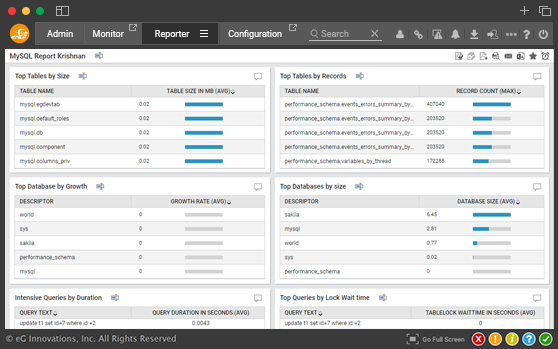
MySQL monitoring and management dashboard

Monitoring KPIs to Identify MySQL Server Bottlenecks

  • Monitor the size of each database; be alerted to any databases that are rapidly growing in size
  • Monitor large tables by size and records for capacity issues and binary log size growth to make sure there is sufficient space available for MySQL's archive log
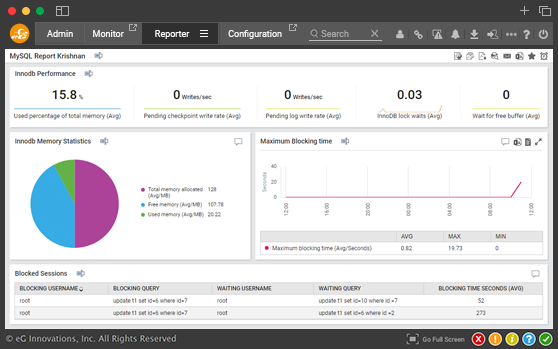
  • Monitor InnoDB, the main storage engine of each MySQL instance. Track throughput, IOPS, pending log writes, and data file pending reads and writes to identify bottlenecks in the database engine
  • Track InnoDB memory usage and receive alerts when memory usage is nearing maximum capacity
  • Identify whether there are an excessive number of locks or lock waits in the InnoDB
MySQL monitoring KPIs
  • Monitor open table count. Make sure this key metric does not hit the max open table count setting
  • Monitor the server's query handler and identify any slow queries

Monitoring MySQL Clusters

  • Monitor the cluster members and receive alerts if any unavailability or slowness is detected
  • Monitor the state changes of any of the nodes in the cluster
  • Monitor all the KPIs per node in the cluster
  • Monitor the workload on each node and identify situations where one node is more heavily loaded than the other
  • Monitor whether the replication works fine and detect any back lag as per RTO objective and help to take preventive action
Monitoring dashboard for MySQL clusters

Monitor MySQL Database Performance from an Application Perspective

eG Enterprise application performance monitoring allows database performance to be monitored in the context of the applications using MySQL database servers.

  • Without requiring any agents on the database servers, eG Enterprise APM traces all application accesses and reports on slow queries and exceptions during database processing.
  • When a specific web page or URL is slow, you don't have to spend hours figuring out what is causing the slowdown. eG Enterprise APM gives you the answers at your fingertips.
  • Eliminates finger-pointing between application development, application operations, and database admin teams by finding the root cause and not the symptoms.
MySQL architecture diagram

How do eG Enterprise's Monitoring Capabilities for MySQL help Database Administrators?

  • Get proactive alerts based on a variety of MySQL database server statistics that are collected and analyzed in real time.
  • Beyond the capabilities of siloed MySQL server monitoring tools, eG Enterprise automatically correlates end-to-end service performance with database, server, and network performance, so that you can quickly determine where the hot spots in the infrastructure are.
  • Analyze MySQL performance trends over time and use the information to proactively adjust performance to improve resource efficiency and optimize user experience
  • Get applications to production faster by substantially reducing the time it takes to identify performance issues during development and testing
  • Eliminate finger-pointing among IT administrators by ensuring that problems are easily and rapidly isolated to specific application tiers, so that only specific administrators need to be involved in firefighting.


Start your free trial or schedule a custom demo with an engineer

  • Works on cloud environments, hybrid cloud setups and on-premises deployments
  • Deploy eG Enterprise using our SaaS platform or on-premises
  • Suitable for monitoring cloud applications, digital workspaces and IT infrastructures
Please Enter Valid Work Email
eG Enterprise