Server Monitoring Simplified
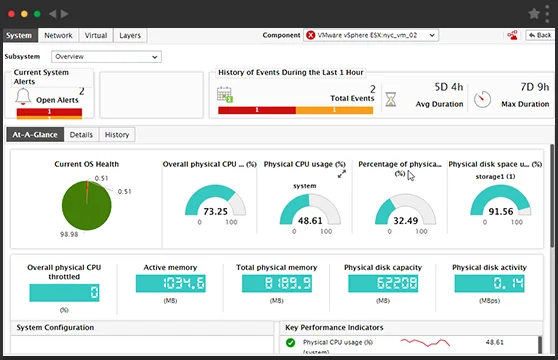
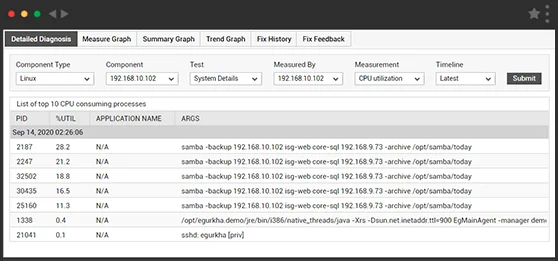
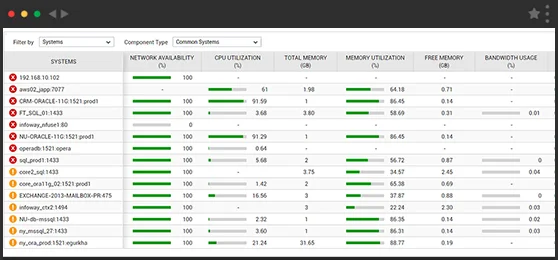
Centralized performance visibility for physical, virtual and cloud servers. Monitor all KPIs of server performance. Automated diagnosis and comprehensive reports make it simple to troubleshoot server slowness.
Free TrialWhy is Server Monitoring Needed?
Servers are the heart of any IT infrastructure. To ensure peak performance of applications, the server hardware must be working well, the servers should be sized correctly to handle the workload, and there should be no resource bottlenecks.
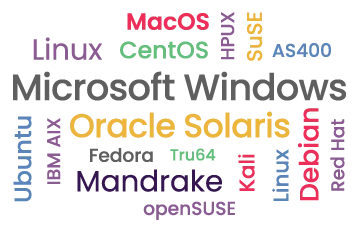
eG Enterprise is a unified monitoring, diagnosis and reporting solution for modern server farms. It offers broad coverage with support for 10+ operating systems including Windows, Linux, AIX, Solaris, and HPUX. Our universal monitoring technology and easy to use layer model representation for tracking performance make eG Enterprise an ideal server monitoring solution.
Why is Server Monitoring Challenging?
- Heterogeneous server infrastructure: The variety of server hardware and operating systems in use makes it impossible for one administrator to manage all of these technologies. Organizations often have multiple administrators and multiple tools for hardware and OS monitoring and there is no integration or correlation between them. Consequently, problem diagnosis is a long and manual process.
- Dynamic and virtualized infrastructure: The increasing use of server virtualization is also changing the way in which server monitoring needs to be done. In fact, there are more virtual servers being deployed today than physical servers. Conventional performance monitoring tools and processes used for managing physical servers are no longer sufficient for monitoring virtualized servers.
With eG Enterprise, we can now quickly identify root causes of incidents, resolving them before users are impacted. Automatic prioritization and categorization of alerts helps us better focus on the important issues and prioritize our resources accordingly.![]()
Server Monitoring with
eG Enterprise
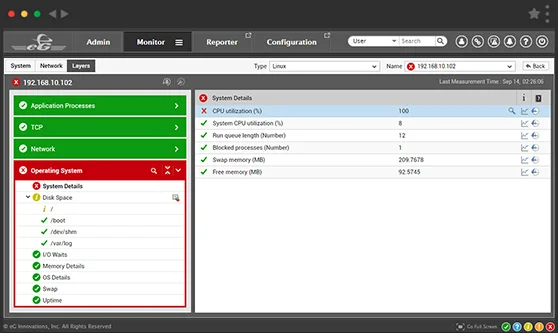
Layered Stack Models Make Monitoring Simple
Simple, consistent layer model representation depicts the functioning of different server hardware and operating systems. By hiding the complexity of the underlying environment, they make monitoring simple. Even non-experts can use the tool for monitoring and troubleshooting servers.
Layer models facilitate problem demarcation. Know if the problem is in the hardware, operating system, network or application layers and get the right experts involved in troubleshooting.
Unified and consistent interface for all server hardware and OS ensures short learning curve for administrators.
Key Server Performance Metrics Monitored
While CPU and memory monitoring are no doubt important, as server operating systems have evolved, it is important to track several other performance indicators about server operating systems that can be indicative of performance bottlenecks.
| CPU utilization | Memory utilization | Disk space utilization |
| Top processes by CPU/memory/Disk | Disk activity levels | Network traffic |
| Hardware status | Status of daemon processes | Handles usage |
| Page file usage | Server uptime | Network interface status |
| Network connectivity | Windows service status | File share status |
| TCP traffic | Syslog errors | Event log errors |
| Handles used | Time sync status | Context switches |
Frequently Asked Questions (FAQs) about Server Monitoring
Server monitoring refers to monitoring the health of servers in your IT infrastructure, irrespective of whether these servers are hosted on physical machines, virtual machines, or on cloud instances.
Server monitoring proactively check various aspects of server health including its uptime, availability, responsiveness, resource utilization level (for CPU, memory, etc.), disk availability and usage, network interfaces and status of key processes and services. Monitoring of server event logs (syslog, event logs, etc.) is also included in server monitoring.
Server monitoring is usually agent-based. Agentless monitoring is also supported but it must be noted that there are several caveats with agentless monitoring. Firstly, agentless monitoring requires remote access to admin accounts for monitoring the servers. This can cause unexpected security issues. Secondly, agentless monitoring often takes up a lot more bandwidth for monitoring. Hence, agent-based monitoring is preferred.
Yes, server monitoring tools like eG Enterprise do provide options to remotely execute commands on the servers being monitored. Command execution rights are assigned based on user roles, to minimize chance of misuse of these permissions.
Yes, server monitoring tools like eG Enterprise monitor both the performance of the server and its configuration. Configuration changes like OS version change, new software being installed, hot fixes applied, etc. can be tracked and reported.
This depends on the architecture of the server monitoring tool. For example, with eG Enterprise, you do not have to open any TCP/UDP ports on the server. All communications are initiated by the agents to the manager. So the server monitoring architecture is very secure.
This depends on the architecture of the server monitoring tool. For example, AppDynamics has a separate machine agent and an application agent.
On the other hand, eG Enterprise has a single agent that can monitor the server OS and the applications running on the server. The advantage of this approach is that you can start with server monitoring only, and then add application monitoring capabilities easily, without having to install another agent on the server for application monitoring.


