Red Hat Monitoring with
eG Enterprise
Holistically monitor your Red Hat OS, Server, Virtualization, Containers, and Application Server platforms through a single console.

Free Trial

Trusted by leading companies

eG Enterprise is a comprehensive user experience monitoring solution for all things Red Hat. Administrators can get answers to all the critical performance monitoring questions that they have about Linux OS and application performance. eG Enterprise also provides complete visibility into the performance of virtualized infrastructures. Its virtualization monitoring capability provides insights into hypervisor and virtual machine performance.

Red Hat

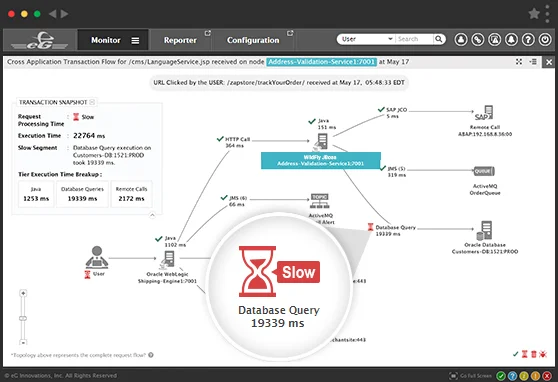
For application operations teams, eG Enterprise can also be used to monitor the Red Hat middleware application platform. Its JBoss monitoring capability tracks the performance of JVMs, the JBoss container, and deep dives into transaction-level performance breakdowns.

For modern infrastructures, where Red Hat OpenShift is used for dynamic provisioning and supporting micro-services, eG Enterprise monitors the OpenShift clusters as well as the Core OS (CRI-O) container engine. Owing to these varied capabilities, eG Enterprise is a monitoring tool of choice for thousands of Red Hat clients worldwide.

Get 360° visibility
from a single pane of glass for all Red Hat platforms

Red Hat Enterprise Linux (RHEL) Monitoring for
Superior Server & Application Performance

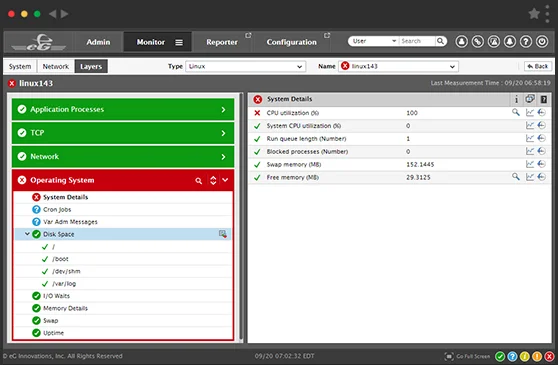
Red Hat Monitoring dashboard
  • Go beyond CPU, memory, and disk utilization monitoring; provide insights into all key performance indicators of Red Hat Linux performance.
  • Automatically collects detailed insights when problems happen, thereby enabling effective post-mortem diagnosis of problems.
  • Auto-correlates application performance and OS performance to identify the root cause of problems.
  • Auto-baselines all metrics and provides alerts whenever there is any deviation in server performance.

eG Innovations delivers a robust, reliable and extremely valuable solution to deliver maximum uptime and user satisfaction. Pre-emptive alerting helps us to address performance issues immediately before they affect system and application availability.

Mike Montano Senior Manager, Allscripts

Red Hat Enterprise Virtualization (RHEV) Monitoring to Enhance Virtual Machine and Application Performance

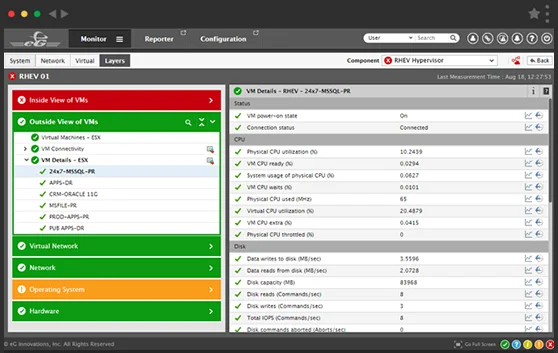
RHEV is one of 10 virtualization platforms supported by eG Enterprise. Without needing agents on the RHEV servers, eG Enterprise:

  • Analyzes the performance of the RHEV infrastructure at every layer, including the RHEV hypervisor, VMs, and applications executing on the VMs
  • Provides a 360° view of VM performance, thereby helping identify which VM and which application inside the VM is responsible for hogging resources
  • Eliminates silos and diagnoses performance issues in minutes through virtualization-aware topology mapping and automatic correlation
Red Hat Enterprise Virtualization - RHEV - Monitoring screen
  • Provides historical reports and analysis to help right-size, optimize, and plan for VM capacity


JBoss Monitoring for Faster Java Application Performance

  • Identify user experience issues and sluggish transactions using real user monitoring and synthetic transaction monitoring. Determine whether the problem is with the browser, the network, or the server, and provide a positive digital experience.
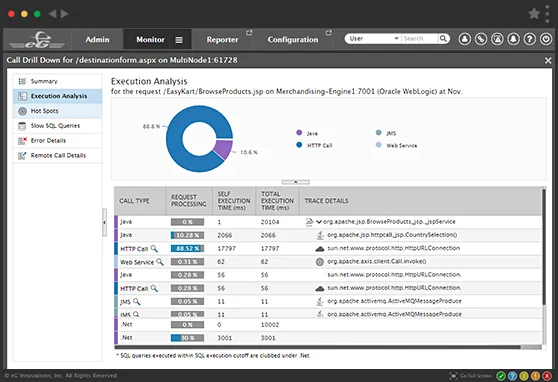
  • Get detailed diagnostics for all JBoss components, including EJBs, JSPs, Servlets, DataSources, Connectors, JMS Message Queues, JPAs, and more.
  • Developers can easily identify the application codes in slow business transactions, errors, long-running database queries, and insufficient Java heap memory settings. Also, isolate high-CPU threads, waiting threads, and root blocker threads in the JVM.
JBoss AS/:AP validation
  • It is a single monitoring platform for everything Java: JVMs, containers, web front end, databases, and underlying physical and virtual infrastructure.

Monitor OpenShift Clusters and Ensure that Your Microservices are Performing Well

eG Enterprise aims to ensure OpenShift clusters, containers, and application workloads are performing to their fullest potential:

  • Auto discover the OpenShift clusters, namespaces, pods, nodes, and containers.
  • Automatically start monitoring each container and applications running on it.
  • Monitor key CRI-O engine metrics and get a consolidated view of your system's clusters and nodes.
  • Monitor CPU, memory allocation and utilization for each node in the OpenShift cluster.
  • Use operational statistics, such as the quantity of resources consumed and cluster and pod utilization details to track the capacity and resource use of your cluster and delve into individual portions of the cluster for better allocation and resource management.
OpenShift Clusters


Start your free trial or schedule a custom demo with an engineer

  • Works on cloud environments, hybrid cloud setups and on-premises deployments
  • Deploy eG Enterprise using our SaaS platform or on-premises
  • Suitable for monitoring cloud applications, digital workspaces and IT infrastructures
Please Enter Valid Work Email
eG Enterprise